Helen Roberts 10P
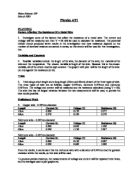
Suitable equipment
-
List of Equipment
3m of nichrome wire (0.274 mm diameter)
2 component clips
Ammeter – 10-amp range
Voltmeter – 20-volt range
Rheostat
3 Cells
Wire
Prediction
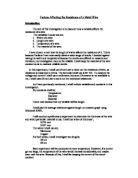
- My prediction is that the longer the length of nichrome wire used, the greater the total resistance. Resistance increases the more components connected in series, and I think the same will be true with the increasing length of the nichrome wire. In the trial, the longer length of wire had more resistance than the shorter one. Electric current is the flow of electrons, and the electrons come from the metal wires, leaving behind the rest of the atoms. As the electrons flow into the rest of the atoms, they collide and the current decreases. Therefore the more collisions there are, the more resistance there is, so a longer wire would increase resistance.
Range of Measurements
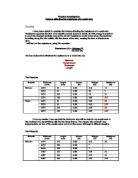
- I am going to take six readings of the current and the voltage. The six lengths I use will be 50cm, 100cm, 150cm, 200cm, 250cm and 300 cm. Then I will do two repeats of the experiment, to highlight any anomalies and to get the most accurate results possible, and use the averages for the resistance.
Method/Strategy
- The circuit will be set up as in the diagram above, with the measured amount of wire connected. Each length of wire will be measured using a meter rule before being connected with the crocodile clips. The voltage and current will be read off the meters, in order to calculate the resistance.
Helen Roberts 10P
OBTAINING EVIDENCE
Helen Roberts 10P
ANALYSING AND CONSIDERING EVIDENCE
Graph
Conclusion based on graph
- The line of best fit on my graph is a straight line. This shows that the resistance is proportional to the length of the nichrome wire used.
Explanation of Conclusion
-
As the length of nichrome wire used increased, so did the resistance. This is because electric current is the flow of electrons, and the electrons are a part of the metal wires. When they flow around the circuit, they leave behind the rest of the atoms. As the electrons flow into the rest of the atoms, they collide and the current decreases. Therefore the more collisions there are, the less current there is. As V=IR, the lower the current, the higher the resistance. For example in the initial results, when the length of the wire was 50cm, the current was 0.150A, and the resistance was 9.000Ω, and when the wire was 300cm, the current was 0.030 and the resistance was 38.750Ω. The current had gone down by 0.120A whilst the resistance had increased by 29.750Ω.
Findings Related to Prediction
- My prediction was that as the length of wire increased, so would the resistance. From my results when plotted as a graph, I can see that this is true. However, there was one result that I got that did not support my prediction. This was the one for my initial results, at 300cm. This reading was lower than the one for 250cm, but I think this was not properly read or calculated.
Helen Roberts 10P
EVALUATING
Relevant Comment About Procedure
- When taking the readings, it was sometimes difficult to get an accurate reading, as the meters sometimes flickered between different numbers. Also it was difficult to make sure the correct length of wire was used, as when it was measured it was not completely straight. This may have slightly affected our results, but I don’t think it would have made them that different.
Quality of Evidence
- My results were quite close to the line of best fit, although did not touch it at many of the points, so this could show that results were not completely accurate. The range of readings was good; they were not all very close together, so it was easy to see how the values changed. I have highlighted the anomalies in the table. The result I would expect to get for the anomaly is around 52Ω, as this is the average of the other two values I got for that length of wire (300cm), and I think that these two readings were more accurate.
Suitability of Procedure
- I think the method was suitable, and the only difficulty I would change is the fact that the wire was not always completely straight, which I have written about above. Apart from doing more reading to get more accurate results, I would use wire that was flatter with the lengths previously marked, as it was quite difficult to change the position of the crocodile clips once the circuit was all connected.
Reliability of Evidence
- I think that if I repeated the readings, I would get the same results, or at least very nearly. However, to ensure this I would have to use exactly the same equipment again. The results increased quite steadily, so I think they are quite good.
Evidence is Sufficient to Support Conclusion
My evidence is sufficient enough to make a firm conclusion, as the results were similar in all of the repeats (apart from the anomaly). To be certain that it was valid, I could use more lengths, such as carrying on to 350cm and 400cm etc. if the results continued to change in the same way, I could be sure my conclusion was correct.
Accounting for Anomalies
I only had one anomaly, so I think that it was just a case of reading the meters incorrectly, or making a mistake when measuring the wire.
Further Work to provide additional Relevant Evidence
- I would extend the range of the lengths of wire. If I did this, I could see if the pattern I predicted carried on, or if it changed the rate at which it changed. If I repeated with a different material, e.g. copper wire (as in the preliminary work) I would do the procedure the same way, using the same lengths and calculating the resistance using V=IR.
Helen Roberts 10P
Looking at the Graph
- The results were accurate enough to produce a good graph, and no real anomalies show from it. I have highlighted the anomaly in the table. The result I would expect to get for the anomaly is around 52Ω, as this is the average of the other two values I got for that length of wire (300cm), and I think that these two readings were more accurate.
Looking at the Table
- I think that the table was a good way to record the evidence, and I found it easier to see any anomalies more easily than from the graph.
Reliability
- When the readings were repeated, the trend was the same, so I think that the results were quite reliable. That is why I think the evidence is sufficient to support a firm conclusion.
Anomalies
- I had one anomaly, and I think that it was because of an error when measuring the length of wire, or perhaps when reading the multimeters. Because there was only one, I think that the rest of the results are good.
Improvements
- I could use more lengths, such as going up to 500cm instead of 300cm. Or use smaller difference between the lengths, such as 10cm, 20cm, 30cm and so on. These could give me a clearer picture of the pattern when increasing the length.
Improving the Reliability
- I would try and be more careful when measuring the length of wire used, as I think that is why I had an anomaly. This would improve the reliability of the results, as they would be true to the length of the wire.
Extending the Investigation
- To extend the work I could use a different type of wire, or adjust the lengths I used. This would show the trend when varying the lengths and would lead to a better conclusion, and would see if the type of wire affected how the resistance changed.