To find these, I used the formula:
R24 = 6/7 x 2850 = 2442.9
(but for each value I put the resistance I wanted to find at the beginning e.g. R24, R20, R16 etc. Then I divided this number by 28(which I could round down to 7), the value which I already knew, and multiplied this all by the value of 28, which was 2850.)
Therefore, the formula is: Rn = n/28 x 2850
I used this formula to make all the predictions in the table above. These predictions rely on the fact that in this experiment, resistance increase and length increase are proportional. The reason that I think this is that during my last experiment, where I used a wire with variable length instead of resistance paper, and it was proportional. Therefore, as this experiment is very similar (substituting the wire for resistance paper), I think the graph and results will also be similar. I have made a separate prediction graph.
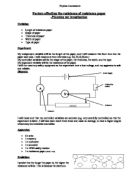
Obtaining My Evidence
Analysing My Evidence
In my experiment, I did get similar results to those which I predicted. Also, my two graphs (the prediction and the results) had similar shapes, as both were straight lines, both were positive with strong correlation, and in both graphs the line was such a shape that it proved that the two values were proportional.
In my prediction: Rise/run = 20.36/20 = 1.018 In my results: Rise/run = 16.80/20 = 0.840
Rise/run = 16.29/16 = 1.018 Rise/run = 13.80/16 = 0.860
Rise/run = 12.21/12 = 1.018 Rise/run = 10.70/12 = 0.892
Average = 1.018 Average = 0.864
Also, the gradient on both graphs were very similar, which is further proof of proportionality. Above I have shown the gradients of both graphs, and this is calculated by choosing a point on the graph, measure its height and length using the scales on the graph (e.g. if the length is in cm and height is in miles, the values are kept as they are in these units). Next the height is divided by the length to give the gradient. This is often referred to or remembered as “rise over run”, which is a less scientific way of expressing “height/length”.
I expected my results to be proportional because of several theories/formulae. The most basic of these is the equation which is used to find resistance,
V = IR, rearranged to be R = V/I
This shows that voltage (V) is constant, and that current (I) decreases as resistance (R) increases. This can be explained by the nature of electrons and ions, and relates to the diagram drawn in my prediction, because as resistance increases, there are more obstacles for the electrons and ions to collide with, so the current is lower. Therefore:
As Resistance Increases, Current Decreases
This is also known as Ohm’s law. As length increases, resistance increases. This is because in a longer wire/length of resistance paper, there are more obstacles for the electrons to collide with, so
As Length Increases, Resistance Increases
Evaluating My Evidence
I felt that my experiment went very well overall, and that I used suitable and reliable equipment which is shown by the precision of my results. My prediction was also accurate, which was displayed by the two similar gradients of my graphs (prediction and results). Due to the care I took in controlling my variables, I obtained results which were as accurate as possible, and I can state this because the graph of my results formed such a strong correlation. This also meant that I did not have any anomalous results, as all results on the graph were very close to the line of best fit. This means that my evidence is good enough to support a firm conclusion, as I have proved it to be accurate by i) the lack of anomalies
ii) reliability of my apparatus
iii) strong correlation of results
If I did this particular experiment again, I would make very few changes. One change I may make would be to increase the amount of results in my previous experiment, which I based my prediction upon. If I had done this, I could have made an average and based my predictions upon this. The danger of not doing this is that I could have based my predictions on an anomaly. I did not use just one result, but I did use only a few, which may have been the cause of the slight difference between my predicted results and my obtained results. Had I done this, I may have increased the reliability of my predictions, but this would not have affected my obtained results, so if I had only based my predictions on one result, it would not have been very important. As it was, my prediction was fairly accurate, so I obviously did not use an anomaly. This brought to the conclusion that my experiment was a success.