Finally I will be using the same type and atomic structure of wire each time because it will be unfair for me to use a different type as I will be changing the number of free electrons available in the wire. Also as the atomic structure determines how easy it is for the electrons to pass through the wire and therefore alter the current.
Prediction:
I think that the current will become greater as the cross-sectional area of the wire gets bigger. I think that this will happen because when the cross-sectional area is greater then there is more space between the atoms so therefore it is easier for the electrons to pass through the wire as there is less resistance for the electrons to fight against. So therefore there is a higher current flowing through a wider wire as there is less opposing resistance. The Resistivity of copper wire is 1.7×10⁻⁸ Ωm. From this I can work out the resistance of copper, using this equation:
Resistance = (Resistivity × Length) ÷ Area
Therefore using this formula I can find the resistance of each cross-sectional area that I used;
Resistance = (1.7×10-8 × 1) ÷ each different area
Therefore I can draw a table up of all of the different resistances of all the different cross-sectional area;
Then from these resistances I can work out a set of predicted results for the investigation. To do this I must use the formula;
Current = Voltage ÷ Resistance (I = V ÷ R)
For instance for the area of 0.164 the current would be;
0.25 ÷ 0.103 = 2.43 (3 s.f.)
Therefore I can draw up a table of my predicted results;
Preliminary investigations:
I decided to carry out a set of preliminary investigations as I felt it would be very useful for me to have had a practice using the equipment. Also it was very helpful in perfecting my method and choice of apparatus.
In these investigations I planned to test my method and apparatus to make sure that I would all work properly for my actual experiment. Firstly I tried to obtain 1 volt using a 0.656mm² wire (20 SWG). However we could not reach it even with the rheostat on maximum, as it was too wide and effectively a short circuit. Even when I used a larger rheostat the currents were too large with the 20, 22 and 24 so I abandoned them. So I decided to use 0.25 volts on every wire width and use only from 26-36 SWG wires. So I tried this on this on the two extremes of width, 26 and 36, and repeated both three times, I was able to obtain this voltage on both widths so I decided to use 0.25V. My preliminary results were as follows;
Analysis:
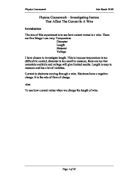
I can see from my results that when the cross-sectional area I larger the current is also larger. Further, as the cross-sectional area doubles the current also doubles, as supported by my cross-sectional area against current graph. The cross-sectional area affects the current because of the number of electrons that can fit through the wire. Therefore if there is a larger cross-sectional area then there will be more electrons passing through it per second.
For the cross-sectional area against current graph there is a straight line, this represents the fact that as the area doubles so does the current. For instance when the area doubles from 0.02 to 0.04, the current doubles from 0.15 to 0.30. However on the diameter against current graph we can see that firstly the current increases slowly but it increases progressively greater as more and more paths for the electrons become available. For instance I will look at a rise of 0.05 mm at two different locations on the graph to show the increase. From 0.1mm to 0.15mm the current increases 0.08 amps but from 0.3 to 0.35 the current increases a much greater 1.8 amps.
So if the cross-sectional area increases it means that there are more gaps between atoms, so there are more routes for the electrons to take. Therefore when the cross-sectional area doubles the number of routes doubles, so therefore the current doubles.
This supports my prediction totally as I predicted that the larger cross-sectional area the larger that the current will be, due to there being less friction and more spaces for the electrons to fit through. Therefore my results and graphs prove and support my prediction.
Evaluation:
I feel that my investigation was reasonably effective, productive and also my results support and prove my prediction to be correct. My results were fairly accurate although I did have one slight anomaly for the cross-sectional area of 0.029 mm², there is a contrast of 0.6 amps between reading 1 (0.21amps) and reading 3 (0.27 amps). Also I found that when I compared the predicted results that I had accurately calculated to the results that I had collected in this investigation, I found that although the same pattern could be seen in both sets of results, the collected results were almost exactly half of the accurately predicted ones. Therefore there must have been a repetitive anomaly in all my data. This can be accounted for by the fact that it was most likely that the wire that I used from the rolls for my investigation might have been out from the measurements that they were supposed to be, due to improper sizing at the factory or malformation since it was produced. Therefore the diameter would have been different than it was supposed to be and so this would cause my results to be much different from what they should have been, therefore explaining why my results were half of what they should have been, so these problems must have caused more resistance therefore less current.
My procedure although effective did have some problems, for instance even before I starting collecting my primary evidence I found that in needed a bigger Rheostat because I could not reach a high enough voltage.
However, with hindsight I can see that there are some improvements that need to be made. Firstly it would have been much better to have used a micrometer to measure the diameter of the wire and then work out the cross-sectional area from that reading, rather than assuming that it was the exact diameter that it should have been on the roll due to its SWG. Also it would have been better not to have used crocodile clips to attach the sample wire to the circuit as thee clips increased the length of the wire and therefore interfered with resistance and therefore the results.
To calculate and assess the reliability of my results or evidence, it would be very useful to look at the percentage error for each different reading; there will be six values as I tested six different cross-sectional areas of wire. I will read the value of the points on my graph which represent my data and the point on the line of best fit which is also at the cross-sectional area of the original point, so therefore this point can be said to be more accurate. Then I will divide the difference between the points, of my result and of the point that it on the line of best fit, by the value of the point on the line of best fit (the more accurate point). Then I will times this number by one hundred to give me a percentage error with which to assess the quality of my results. Therefore I ended up with these results;
Therefore the overall average, percentage error = 4.88% (3.s.f)
Therefore I can say that as the percentage error of my evidence was only 4.88, overall my results were consistently quite accurate and reliable.
For my investigation I feel that it would be a good to do some extension work to create a more broad variety of evidence with which to back up my investigation. If I investigated the effect of lengthening the wire, on the current then I would be able to draw up a further conclusion for this factor. I know that if I increased the length of the wire then resistance in the wire would be greater, also if I double the length of the wire then the resistance would also double. This is because there would be twice the amount of atoms for the electrons to get past so it would be twice as hard to do this. Therefore as the resistance increases it causes the amount of current flowing through the wire to decrease. This would cause a negative coloration on a graph showing the length of the wire against the current flowing through it.