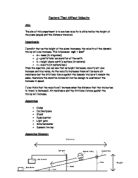
For the second part of the experiment I will vary the distance that the dynamic trolley has to travel by moving the light gate to different points along the plane.
Safety:
There are a few safety precautions that need to be taken to make sure that the trolley does not break or cause any injuries. Placing a foam barrier at the bottom of the ramp should absorb the impact of the trolley and dissipate any harmful forces. Another precaution is making sure that the apparatus is securely placed so that it does not unintentionally fall and cause injury.
Results:
Table 1: showing the velocity of the trolley at different heights.
sinø was calculated by: (opposite/hypotenuse)
= (height/1.8)
Table 2: shows the velocity of the trolley when travelling different distances.
Analysis:
Graph 1: the relationship of the velocity squared (v²) of the trolley with the height of the plane.
Graph 2: the relationship of the velocity squared of the trolley when the height of the plane is changed.
Graph 3: shows how the velocity of the trolley is affected by the distance travelled.
Evaluation:
Graph 1 shows that the velocity squared (v²) increases as the height of the ramp increases and therefore my hypothesis is proved correct. This can be explained by the principle of conservation of energy which states that energy cannot neither be created nor destroyed, but it can be changed into other forms. At the top of the ramp, the trolley has gravitational potential energy (GPE) which is converted into kinetic energy as the trolley travels down the slope. However, as according to the principle of the conservation of energy, no energy is wasted, the potential energy is transferred to kinetic energy. Potential energy (PE) is energy due to position and kinetic energy (KE) is energy due to motion. The higher the trolley is, i.e. the greater the height of the ramp, the greater potential energy it has and therefore the more energy can be converted to kinetic energy when the trolley moves.
Potential energy therefore equals kinetic energy:
GPE = KE
GPE = mgh
KE = ½mv²
½mv² = mgh or
v² = 2gh
So, as the height increases there is a linear increase in the velocity. v² = 2gh obeys the equation of a straight line (y=mx + c), and therefore the line of best fit drawn on graph 1 shows the gradient to be equal to 2g, which is 14.67. Therefore g is equal to 7.335. (g is not 9.81 m/s2 because of resistive forces)
The line should pass through the coordinates (0,0), because when height is 0, v² will also be 0.
v² = 2gh ---> (2)(7.335)(0) = 0
The conservation of energy assumes that no energy is wasted; however, in reality some energy is lost, as heat and sound energy. This is why all the points that are plotted in the graph do not fall exactly on a straight line.
Graph 2 shows velocity squared (v²) against Sinø. Like graph 1, graph 2 also has a linear relationship. This is because:
v² = 2gh
sinø = opposite (height)/ hypotenuse (1.8m) therefore
h = 1.8sinø
v² = 2g(1.8 sinø)
v² = 3.6gsinø
Therefore sinø increases with velocity.
v² = 3.6gsinø (this is the equation of the line on graph 2). This obeys the equation of a straight line (y=mx + c), and therefore the gradient is equal to 3.6g.
g should be equal to the one calculated from graph 1 because:
From graph 1: v² = 2gh
From graph 2: v² = 3.6gsinø
And therefore: 2gh = 3.6gsinø and g is a constant
From graph 2 I worked out that the gradient is equal to 26.67 (2d.p.) and therefore g is equal to 26.67/3.6 = 7.4. both values are close, they are not completely equal probably due to human error.
Graph 3 shows velocity against length of the ramp. As the length increases the velocity also increases but it is not a linear increase, but as the graph shows, a curved one. This is due to terminal velocity.
A: Gravitational force is acting on the object with little resistive forces (e.g. friction, air resistance) and so the forces are unbalanced and the velocity is increasing at its greatest rate. Thus, the line on the graph is at its steepest.
B: The resistive forces are increasing but the forces are still unbalanced and so the velocity increases but not as much as in A. Therefore the curve is not as steep now.
C: The forward force is equal to the resistive force and so the velocity does not increase but stays constant, and a plateau is reached as shown on the graph. This is terminal velocity.
When the distance is short, the major force is the gravitational pull and forces are unbalanced. As the length increases, comes into place: when an object stays at rest or moves at a constant velocity, there must be balanced forces.
From graph 3, I can see that the terminal velocity is
Improvements:
There are many ways in which my project could have been improved. I could have:
- Taken more than three readings; this would have made the accuracy of the data much more reliable.
- Used larger range of heights and distance, this could have shown me whether the trend I got from the graphs continued and so forth, the results and graphs would have been more accurate.
- In this experiment, the height and length were changed by 0.05m and 0.2m respectively. The accuracy of the results could be improved by implementing smaller changes in the height and length of the slope.
- A more uniform ramp could have been used to decrease frictional forces against the trolley.
Conclusion:
From the results and my analysis of them, I can conclude that when one variable changes, it will effect other variables, depending on what the relationship is between the two variables. In the lab when the:
- frictional coefficient increases, the acceleration decreases.
- height of the slope increases, the potential energy of the trolley increases.
- angle of the incline increases, the velocity increases.
- distance travelled increases, the velocity also increases but only until the forces become balanced, which then results in constant velocity.
Bibliography:
- Understanding physics for advanced level by Jim Breithaupt
- Advancing physics CD-ROM