ρ = RA
L
Where:
ρ = resistivity of the material. It is the measure of the resistance for a unit length and cross sectional area of the material and has the units.
R =
A =
L =
Finish
Having a wider piece of carbon track or metal wire is like having several pieces of wire in parallel. This is because when a circuit is in parallel the potential difference remains the same. Therefore an equation can be formed for the resistance, having cancelled the Voltages.
1 = 1 + 1 + 1 ………+ 1
where n = the no. of resistors RT RT R1 R2 R3 R n
????????
As the resistors are: ohms m2
M??
Therefore the value of the constant is L = ohms X meters
The reciprocal of this equation is given for the answer. Therefore, having more current with the same battery voltage means that the resistance has decreased.
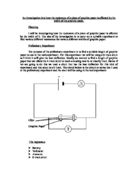
Planned Procedure
1. Uniformly shade in a piece of A4 card an area of 27cm x 15cm with a blunt 6B pencil.
2. Collect a G-clamp and clamp the piece of card between two strips of fairly thick copper sheet to the edge of a table. Place two thirty-centimeter rulers should then be stuck to the carbon track with masking tape. The carbon track will then be slotted between the rulers at the appropriate place. Here is a plan view of the apparatus. ???
3. Set up the rest of the circuit as shown in the diagram. The ohmmeter should be set to milliamp scale for a more precise reading.
4. A copper connector was used??? to connect up the circuit with the graphite track at the 27cm mark. This is the plan and therefore should be in the future tense
5.Continue to move the connector along the carbon track. Readings will be taken from 27cm to 2cm, with 2cm intervals in between.
6.Once I have obtained a set of readings I will repeat the experiment again for the sake of reliability. (Must explain how you intend to do this) I will again take a readings from 27cm down to 2cm.
7.Using the guillotine I will cut off 1cm of the width and then measure the resistance of the track at the 20cm point of the length.
8.Two centimeters will be cut off each time, until the track is 1cm wide. Each time I will ……
FAIR TESTING (Have not read this)
When conducting this experiment I will alter only one variable at a time and keep the other variable constant at a fixed measurement. This will enable me to draw conclusions from my results. When changing the length I will keep the width the same, and visa versa. The voltage being passed through the carbon track will be kept at a constant, 8V. However, due to resistance around the circuit, as well as some of this voltage being used to power the ohmmeter the value is actually smaller. This does not matter to the experiment, as the potential difference is still constant. This is an important part of the procedure.
Another factor I need to control is the thickness of the carbon track that will be drawn. This will be the hardest thing to control thus will be the biggest source on inaccuracy in my results. The experiment must therefore be repeated another time to make sure my results are accurate and reliable. The same carbon track will be used and the resistance will simply be re measured. The pencil used to create the carbon track will also be the same type of pencil. (I.e. the same HB)
Another potential source of inaccuracy is the fact that the graphite track may heat up. To see if this extra thermal energy has a substantial effect on my readings I decided I will have to test it. I set up a simple circuit with an ohmmeter and a 10-ohm rheostat. The current and voltage will be measured and the equation P=IV will be used to work out the power.
The room temperature may also be a source of inaccuracy in my experiment. If the temperature in the laboratory fluctuates during the day changes, the resistively of the graphite will change (because carbon is a semi conductor.) By setting up a control, I will measure the resistance of the same strip of carbon track each hour. I will also be recording the temperature each hour. I will be able to scientifically know if the external temperature affects my results.
Apparatus List:
A jockey so when I draw my carbon track I can place the jockey at different lengths along the line. Carbon is made up of flaky particles closely packed together, thus a large surface area of contact is needed for effective contact. Therefore it may be the jockey is not the best piece of apparatus. A smooth blunt piece of good conducting copper may provide a better contact point
Four lengths of wire to connect the circuit together.
An ohmmeter to measure the resistance through the circuit, as well as to provide the energy for the circuit.
A soft HP pencil, so not to damage the card that it is drawn on.
A piece of card to draw the carbon track on. (50 x 40)???
I could have use a current and a volt meter, as well as a battery cell instead of the ohmmeter. However the ohmmeter automatically shows the resistance without having to work it out using the R= V/I equation. Furthermore the ohmmeter provides energy for the circuit, so a cell is not required.
I have decided to take readings of resistance for lengths up to 27 cm. The readings for the width will go up to 15 cm. I think by using these values I will be able to obtain a wide range of values, thus good results. I will make a reading every 2cm interval. To make sure the readings are reliable I will repeat each reading at least twice. If the results have a big difference then the test for this particular value will be repeated. To make sure my readings are as precise as possible I will measure the length of the carbon track with a ruler with millimeter values on it. The resistance in ohms will also be measured to 2 d.p. by the ohmmeter. Having obtained these results they will be entered into a matrix. Graphs can then be drawn from this table.
PRECAUTIONS AND SPECIAL TECHNIQUES
For this experiment I decided to use card with grid lines photocopied onto it. Card is stronger than paper, so when being coloured upon I will not rip the card. The grid lined will make it easier to colour in exact amounts of the card. I will also use a low HB pencil as they have more graphite in them and less clay, making my carbon track more pure. When coloring in the card I must make sure that the spread of the graphite is uniformly thick (for a fair test). A tissue will be used to rub the surface of the graphite for a smooth surface.
I carried out some prior experiments to determine whether to use a jockey or a piece of copper. I came across several issues. One issue was that the jockey dented the card,(a possible source of inaccuracy). In this experiment I made a carbon track 8cm wide and 25cm long. The jockey has a small connection point so I decided to investigate if the connection point affected the resistance reading. Here are my results:
This experiment shows that the resistance is dependant on where the point of connection is. The resistance is different because the electrons take different paths through the track. Therefore if a length of carbon is used, the connection point is wider, thus removing this source of error.
SAFETY ISSUES
Due to the fact that there is only a very small voltage involved in this experiment there is a very small risk of an electric shock. However, I must be careful not to short circuit the circuit.
Carbon is not a toxic or a poisonous substance, so there is no problem with touching the substance.
None of the apparatus will become overly hot so this too is not a problem.
WHAT WILL I DO TO VERIFY MY HYPOTHESIS?
All my results obtained will be entered into a matrix style table, with lengths along the top and widths along the side. !! Sketch what you mean. I will then plot two graphs. One of length against resistance, the other of width against resistance.
I expect the length/resistance line to be a straight one and to have a positive correlation. The width/resistance line is expected to have a negative correlation and be curved. I will therefore take the reciprocal of my results in order to attain a positively correlated graph. !!! If the relationship is inversely proportional, this will give a straight line correlation. I also expect both lines to pass through the origin meaning it is directly proportional. If this is the case then carbon obeys Ohm’s law. I will also look to see if there are anomalous on my graph. If the points on my graph seem to form part of a curve or a straight line then I will draw a line of best fit. I will also use my graphical evidence to see if it verifies my ideas.
Obtaining Evidence
METHOD
1. A piece of card with grid lines photocopied on was shaded in with a 6B pencil. The carbon track was of size 20x12.
2. A length of copper was placed on the bench, a short distance away from the carbon track.
3. The piece of card with the carbon track was then positioned on the bench with one end of the track covering the copper strip.
4. Two rulers were positioned either side of the carbon track, and tapped to the bench with masking tape.
5. Next, another strip of copper should be positioned on the carbon track, directly above the other copper strip. One end of the copper length was bent upwards to allow a crocodile clip to connect the carbon track to the rest of the circuit.
6. The two copper strips and the carbon track were G-clamped to the edge of the bench.
7. The ohmmeter was turned on and two wires were plugged into the ohm and the common connection.
8. One of the two wires was then plugged into the crocodile clip.
9. The other wire was put into a second crocodile clip, which in turn was clipped to another bent copper strip (the second connector).
10. The connector was positioned 20cm away from the clamped copper strip. At this point the width of the copper strip was 12cm.
11. The resistance shown by the ohmmeter was noted. The connector was then moved a further 2cm towards the clamped copper strip.
12. Measurements were taken for the resistance at 2cm intervals.
13. Once all resistances were noted the experiment was repeated, by carrying out exactly the same experiment. The average of the two resistances were taken as my final resistance.
14. The carbon track was then removed from the circuit and the width was reduced by half.
15. The track was put back in the circuit in exactly the same way as before. The resistances were again found for different lengths of the track (2cm intervals).
16. Once these results had been recorded the same experiment was carried out but with widths of 3cm and 1.5cm.
17. Throughout this experiment the temperature was being recorded throughout the experiments duration.
OBTAINING EVIDENCE-RESULTS
The following tables show my raw results from the experiment, which was conducted on the 17/9/03.
The first table shows the resistance of a carbon track of width 12cm.
When conducted the room temperature was 25oc
??? Layout
The following results show the reactivity of a carbon track of width 6cm.
The temperature when I was experimenting was 26oc.
The following results show the reactivity of a carbon track of width 3cm.
The temperature when I was experimenting was 25.5oc
The following results show the reactivity of a carbon track of width 1.5cm
The temperature when I was experimenting was 26oc.
The following show the reactivity of a carbon track of length 10cm.
Results of Preliminary Experiments
An experiment was carried out to measure the warming of the carbon track. Here are the results.
The current was measured as 23.4 milli amps and the voltage was 0.233V.
!!! Layout as sown previously
Using the equation: P=IV
P=0.233 X 2.34 X 10-6 =5
1000000 watts
A further preliminary experiment was carried out to find out the basic trend expected from this experiment. Here are the results.
Analysis
Having investigated this problem by undertaking experiments and tabulating my results, I can now begin to analyze my results.
The following graphs show the resistance of the carbon track of different lengths and widths.
The results largely confirm my prediction. I stated in my prediction that the resistance is directly proportional to the length of the carbon track. This means that the line of best fit on the graph would be a straight line intersecting the x and y-axis at the origin. Within the realms of scientific error my results confirmed this. Firstly, the points on all of my resistance/lengths graphs were in an approximate straight line, thus the line of best fit was as a straight line The lines however intersect the y-axis at a point above (0,0). Despite this inaccuracy it can still be said that the lines are directly proportional.
A further prediction I made in my plan was that the resistance of the carbon track is inversely proportional to its width. When I first plotted my results of width against resistance the graph showed an asymptotic curve. I then rearranged my widths, taking the reciprocal of each. When this graph was plotted it showed a straight line intersecting the y-axis just above the origin. This result therefore remonstrated that the resistance of this carbon track is inversely proportional to its width.
Overall, my scientific theory was proved correct. It is fair to say that the resistance of a carbon track is exactly the same as a number of resistors in series. The resistances can all be added up to give you a proportional relationship. Furthermore, the width of the carbon track is exactly the same principal as a series of resistors in parallel. The reciprocal of the resistance is the total resistance of the carbon track. Having found both scientific and practical evidence it can be said that my predictions are correct.
If one observes the graphs attained by this experiment, it is clear to see that on all the graphs the line of best fit does not pass through the origin. In fact it intercepts the y-axis at a point just above zero. This may be for a number of reasons. The most likely reason is that there is a small degree of resistance throughout the circuit. This resistance is very small because the metal in the wires copper, as well as my copper connectors are very good conductors. I decided to measure the resistance of this circuit by touching the two copper connectors together. I found the resistance to be 0.2 of an ohm. However, this value does not quite match up with my theoretical results. While I cannot be sure, I think this is because of the shading of the carbon track was not uniform. This would have caused fluctuating readings.
One way to find out how accurate my results were is to measure the percentage error. However, as this is a practical it is not possible to complete this sum. This is because in order to calculate the percentage error the theoretical result has to be known. Furthermore, as I only carried out the experiment for each length of carbon track once, I cannot take the average as my theoretical result. In the circumstances the best way I could find the error of my results is to measure the distance from the point to the straight line. ADD EXAMPLES HERE.
Before conducting this main experiment, a preliminary was carried out. I wanted to check if the heating of the carbon track during the experiment would have an affect on my results. My experiment showed a power rating of 5 watts
1000000
This power rating shows that the heating on the track during the experiment will be negligible. Another factor I was monitoring during the experiment was the room temperature. It was very fortunate in that the day this experiment was being conducted was a cloudy one. This meant that the room temperature increased by only one degree Celsius throughout my experiment. A control was set up to assertion whether the resistance of the carbon track would be affected. With such a small increase in temperature there was no resistance change of the carbon track for a fixed length.
EVALUATION
The problem with every scientific experiment is that the results cannot be measured with 100% accuracy. No experiment will yield exact results. The ohmmeter used in this experiment, although it gives a reading to 2 decimal places, there is still inaccuracy. The ohmmeter takes the centre range of the reading as the value. For example if the resistance of a carbon track is given by the ohmmeter 2.20 ohms. However, the actual resistance ranges from 2.205 to 2.195 ohms. This is an absolute uncertainty. This therefore may have lead to inaccuracy in my results. Despite this there was an obvious pattern in my results. For this reason I feel that my results are reliable enough to draw conclusions from.
When conducting this experiment a digital ohmmeter was used. This therefore means mistakes due to miss reading of equipment has been cut out. If a non-digital piece of equipment were used then it would be hard to accurately read off the recordings. However, when measuring the length of the carbon track a 30 cm ruler was used. As a result of this, when I was positioning the connector onto the carbon track there may have been some inaccuracy. Using a ruler of this kind one can only measure to the nearest mm.
Having carried out the experiment I did not receive any anomalous results that totally contradicted the expected pattern. I did however find that on my graph the reading for the 20cm length appeared to be above my line of best fit. This may be because the carbon track was not uniformly coloured in, and that one side had a greater concentration of carbon per cm squared of card. To find out if this was the case I should have turned the carbon track around and then repeated the experiment.
Overall my plan for this experiment was successful. I was able to clearly identify a proportional relationship for the length, and a clear inverse proportionality relationship for the width. However, I made a few changes to my prearranged procedure. I originally decided to take find the resistance of a carbon track of width intervals of 1cm. But when conducting the experiment I decided to only take readings for 4 widths- 12cm, 6cm, 3cm and 1.5cm. By following this revised procedure I was able to detect bigger differences in the resistively in the carbon track.
If I were to repeat or expand this experiment I would make a number of changes. Firstly I would try to find a way of making the carbon track more uniformly coloured in. Carbon pencils, sold by art shops could be used to make the track more uniform.
When conducting this experiment I took two sets of readings for the same length of carbon track. At the time I thought this to be repeating the experiment. However, in Hindsight this was not a repeat. I was merely redoing the same experiment again with the same errors. If I were to conduct this experiment again I would turn the carbon track around, with the fixed connection point at the opposite of the original end. This would have been a correct repeat, giving me a different set of values to compare, thus a % error could have worked out. An even better way of repeating results would be to have drawn a completely new carbon track.
This experiment could be furthered in a number of ways. Different conductors could be tested, in order to find out their the resistivities. Constantine, copper and lead could all be experimented upon to further my understanding of the principles of resistivity. Having found out that Resistance is inversely proportional to width, and the length is proportional to length for a carbon track, one could investigate whether this rule is the same in other metals.
An allotrope is a different form of an element due to its physical properties.