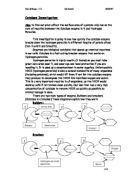
When the temperature is too cold then there is no heat energy for the enzyme. This means the enzyme cannot move around to break down the Hydrogen Peroxide because it has no energy to do so.
(Summary continued)
Around the temperature of 40oC the enzyme can work efficiently, this is about the optimum temperature for the enzyme. The enzyme has enough heat energy to help it move around, and it hasn’t too much heat energy that it starts to denature. This is the best temperature that it can break down Hydrogen Peroxide.
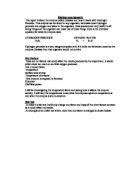
Here is a graph to summarise my prediction.
Mathematical Prediction
The name of this equation is Q10.
Rate at temperature T + 10 = 2
Rate at temperature T
This equation is showing me that when 10oC is added to the temperature, the number of bubbles given off in the reaction should double. This equation is correct up to the optimum temperature.
After that temperature the number of bubbles produced halves itself each time 10oC is added, because the enzyme becomes too energetic and starts to denature.
i.e. 40 = 8 = 2 i.e.2 60 = 3 = 0.5
30 4 50 6
Plan
My range of temperatures went from 20oC – 60oC, we studied 5 temperatures and how they affected my enzyme activity. I picked my range of temperatures because between them all they contain the entire range of enzyme activity.
i.e. 20 = too cold (not a lot of bubbles produced because the enzyme has no energy.)
60 = too warm (not a lot of bubbles produced because the enzyme has denature.)
40 = maybe optimum (enzyme activity high.)
In my experiment I recorded the volume of oxygen given off in 1 minute. To make my results more reliable I did the experiment 3 times and calculated and average to try to eliminate anomalous results. I can tell if my results are reliable by looking at the range of bubbles produced, if the range of bubbles produced is too big then my results are unreliable.
Apparatus
Pre-test 1
I used the size 5-6 cork borer and cut my chips to equal lengths of 3 cm. I used 1 potato chip for each temperature. I decided to use the volume of 25cm3 of Hydrogen peroxide. I also decided to use 25- Vol of peroxide, because this would give a faster experiment than 20 Vol with better results. I thought this strength peroxide would work best with the size chips I used.
(Here are the results of my pre-test.)
Method
- Retrieve your potato chips from potato using your desired cork borer, then cut them to the size of your choice.
- Collect the Peroxide in a boiling tube.
- Fill measuring jug full of water at the desired temperature and place the boiling tube full of peroxide into the water.
- Fill the water bath full of water and then fill measuring jug full of water and place it upright in the water bath; use a clamp stand to hold it upright.
- Place the end of the delivery tube up the measuring cylinder (which is in the water bath) now put the potato chip in the peroxide and quickly fit the other end of the delivery tube to the top of the boiling tube.
- Now time for 1 minute and record the amount of bubbles given off in the reaction in (ml)
Pre test 2
I am doing this second pre-test to find out what the optimum temperature is.
(Results of second pre-test shown below.)
Amount of Oxygen produced (ml)
Analysis
Here is a graph to show my results of my Pre-test.
2 Variables
Dependant – Volume of Oxygen
Independent – temperature
The above means that if the temperature changes then the volume of Oxygen changes. Therefore the volume of Oxygen is dependant on the temperature.
From the graph above I can deduce that the optimum temperature for the enzyme to work at is 40oC. As the temperature increased up to 40oC, the graph showed positive correlation; an increase in enzyme activity. After the temperature of 40oC the graph showed negative correlation; a decrease in enzyme activity because the enzyme has started to denature. At 40oC the enzyme was working at its best as it produced the most oxygen when reacting with the peroxide, it produced an average of 5.10cm3 Which was the most gas produced in the experiment.
From the Pre-tests carried out I have concluded that the best strength Peroxide to use is 20-Vol. I also concluded that the optimum temperature was 40oC.
Relationship
Up to the temperature of 40oC the graph showed positive correlation, after that temperature the graph started to show negative correlation. In my prediction I expected the results to look like this, I predicted that up to 40oC the enzyme activity would be increasing and after that temperature the enzyme activity would decrease.
I also predicted that the optimum temperature for the enzyme would be 40oC.
I can back up my pre-test results by using my scientific knowledge. My knowledge tells me that between the temperatures of 20oC - 40oC, the enzyme cannot gain enough kinetic energy from the thermal energy to move around and collide with the peroxide. The results prove this to be correct because as the temperature increases up to 40oC, so does the amount of oxygen produced; therefore I can deduce that the enzyme is gaining more kinetic energy and colliding with more Hydrogen Peroxide.
The optimum temperature for the enzyme was 40oC, this is the temperature at which the most oxygen was produced.
Between the temperatures of 40oC and 60oC the amount of oxygen produced started to become less. This tells me that the enzyme activity is dropping, this is due to the fact that the intense heat is causing the enzyme to denature; therefore decreasing it reacting capabilities.
Evaluation
The experiments carried out were a complete success as my repeated readings showed near enough the same readings as my original results. All the results showed an increase in enzyme activity up to the temperature of 40oC, they also all showed a decrease in enzyme activity after the temperature of 40oC.
A reliable set of results would look something like this: 0.1, 0.1, 0.2.
An unreliable set of results would look something like this: 0.7, 3.6. 11.8.
My Pre-tests produced 2 anomalous results, one was the first time I carried out the experiment at 40oC, and the other was the third time I carried out the experiment for 60oC.
These results can be explained, they could be due to a old potato chip, or the fact that the water may have cooled down, this would ultimately lead to a decrease in the amount of oxygen produced the reaction.
Improvements
I already decided on one improvement before the experiment, this was to measure the amount of oxygen given off in cm3 instead of counting the number of bubbles given off during the reaction. A further improvement would be to use an electric water bath, these are much more accurate at keeping the temperature the same, and would prevent the effects of cooling water on the enzymes activity. I could have also investigated the affect of surface area on the rate of reaction, this would give a wider range of conclusions from the reaction of Hydrogen Peroxide with the enzyme Catalase.
Extended Surface area investigation
Now I have found out the optimum strength Peroxide and temperature I now have all the information needed to carry out an investigation on the affects that surface area has on the amount of oxygen produced when Hydrogen Peroxide collides with Catalase. To do this I will use different size chips to manipulate surface area; I will use the size 3-4 cork borer and start with cut a total of 5cm long chips.
Aim
To find out if changing the surface area of a potato chip will have an affect on the amount of Oxygen produced when the potato chip reacts with Hydrogen peroxide.
Prediction
I predict that as I increase the surface area, the amount of oxygen given off will also increase.
Apparatus
(I will set up my experiment like this)
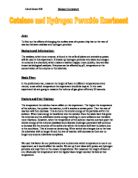
Word and chemical equation for the reaction of hydrogen Peroxide with Catalase
2H2O 2H2O + O2
Hydrogen peroxide Water + Oxygen
Method
- Set up apparatus as shown above.
- Use 20ml of Hydrogen Peroxide.
- Fill the water bath 3 quarters full – 200ml
- Fit delivery tube upon adding chips
- Collect gas for 1 minute and record readings, repeat experiment 3 times for repeat readings.
- Repeat this experiment for other surface areas/chip sizes.
Chip Sizes
I will use 5cm chips, I m going to need 10 5cm chips.
I will leave 2 of the chips as 5cm long for the first experiment.
I will cut 2 other chips into 4 little chips of length 2.5cm for the second experiment.
I will cut 2 more chips into 8 little chips of length 1.25cm for the third experiment.
I will then cut 2 other chips into 16 smaller chips of length 0.75cm for the fourth experiment.
For the final experiment I will cut the remaining 2 chips into 32 smaller chips of length 0.375cm.
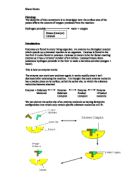
I am cutting the ships into smaller chips to try and manipulate surface area and see if it has an effect on the amount of Oxygen produced in the experiment.
(See diagram below)
From the Pre-test I have decided 4 things:
- Use 20-Vol Peroxide
-
Use the temperature of 40oCfor the experiment.
- Use the larger measuring cylinder as a lot of gas is given off.
- use the biggest size chips.
Analysis
Radius of potato chip = 6mm
Cross sectional area = 13.09
The graph I plotted showed a positive linear correlation. My optimum surface area was 12285.76 mm2; I can conclude from my graph that the bigger the surface area, the larger the amount of oxygen produced in the experiment. This is because there are more faces exposed to the peroxide, if there are more faces exposed then this means there is more Catalase exposed to the peroxide. When more Catalase is exposed, it will be able to break down more Hydrogen Peroxide into Water and Oxygen, therefore the bigger the surface area, the more Oxygen given off from the reaction.
Evaluation
My experiment of surface area was a complete success as all my results were close together and similar. I had 1 anomalous result from my experiment, this was when the surface area of the chip was 12285.76 mm2, it was below the expected amount. This could have been because the chip had cooled down from 40oC and lost its kinetic energy, therefore this COULD have produced an anomalous result.
On my graph I have used the line of best fit, I have tried to go through as many of the results as possible, I also tried to have equal amounts of points either side of the line.
To improve my experiment and minimize the occurrence of anomalous results I could have used a water bath to keep the temperature of the experiment constant. This would prevent room temperature fluctuations which would lead to a change in the enzymes activity, (loss or gain of kinetic energy.)
I also could have weighed the chips instead of cutting them into different sizes, cutting the chips is not very accurate, especially when I was cutting to lengths of 0.3125 cm. If I had weighed the chips its more likely that all the chips would have been the desired size.