Pen & Paper
P6a. & P8b. Method and Scientific knowledge
Method
1. Collect equipment.
2. Set up equipment, as shown in apparatus diagram.
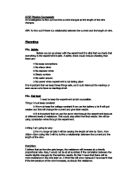
3. Use metre ruler to measure 100cm of wire, and attach crocodile clips.
4. Switch on, use variable resistor to get 0.50V on voltmeter.
5. Record reading from ammeter, then switch off to let the wire cool down.
6. Repeat steps 4 and 5, for lengths 90cm, 80cm, 70cm, 60cm, 50cm, 40cm, 30cm, 20cm and 10cm.
I have chosen to use a switch to be able to turn the voltage on/off, so that if I am not carrying out the experiment I can save the power. Also if I leave the battery on it may create heat and heat can have an affect on resistance. I am using a variable resistor to vary the resistance so I can keep the voltage at 0.50Volts.
With all of this in mind I hope my prediction will be correct, and as the wire doubles in length the resistance doubles.
Scientific knowledge
Current is a flow of charged particles, usually through a circuit. Resistance is in electricity; it is a property of an electric circuit or part of a circuit that transforms electric energy into heat energy. Resistance is often considered as being in such devices as lamps, heaters, and resistors.
Resistance has a relationship with length, the longer the length of the wire the greater the resistance. This is because there are more positively charged particles to get in the way of and collide with the electrons. This means there are more particles to get past so the resistance is increased.
I have used a switch to make sure that when I am not using the circuit, the battery is not wasted. I am using a switch to turn the circuit on and off, so I don’t waste volts and cause the battery to overheat. I am using a variable resistor to be able to keep the voltage always at 0.5V. I have used a voltmeter to make sure that the voltage is 0.5V all the time. The relationship between voltage, current and resistance is expressed in Ohm’s law.
Ohm’s law is: R=V¸I
RESISTANCE (W) =VOLTAGE (V) ¸CURRENT (A)
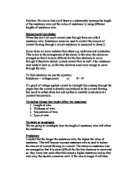
Ohm’s Law states that: the current flowing through a wire is proportional to the potential difference across it (as long as the temperature stays the same).
Also if the length of the wire is too short, it may cause overheating. If the wire is too long, there could be too much resistance.
There are four main factors that affect resistance, these are:
Temperature of wire
Different material for wire
Varying length of the wire
Varying cross sectional area of the wire
P6b. Suitable range
For my range of data I will be varying the length of wire by 10cm, from 100cm-10cm doing this I will try to find a relationship between the current and the length of the wire.
Preliminary experiment
In my preliminary experiment I used the following equipment to carry out an experiment as accurate as I can.
Constantan Wire (100cm)
Cell two batteries
Switch
Circuit Wires
Crocodile Clips
Scissors
Meter Rule
Ammeter
I obtained these results:
Preliminary experiment results
On the next two pages are my graphs for the preliminary experiment, taken from my preliminary results.
Preliminary experiment analysis
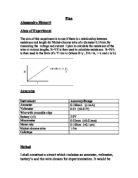
The basic trend of my graph (1000/length) is that as the length decreases the current increases and it is in proportion. I am hoping that I will get similar results, but I expect them to be more accurate and hopefully I will find it easier to make a conclusion.
Obtaining
I used the following equipment:
Constantan Wire (100cm)
Cell two batteries
Switch
Circuit Wires
Crocodile Clips
Scissors
Meter Rule
Ammeter
Variable Resistor
After my preliminary experiment I have decided to find out the resistance, I have done this to see if there is any relationship. I have also decided to work out 1000/length to see if it is inversely proportional to current.
Results for the experiment
On the next three pages are my graphs for the experiment, taken from results.
Analysing
Having completed my experiments, I have found that current decreases when the length of wire increases & increasing the length increases the resistance.
From my graphs I can see the following patterns:
Graph 3
This graph shows that as length increases the current halves. There is a steady increase.
Graph 4
My results were closer together, my results were inversely proportional. One anomaly due to human error.
Graph 5
As the length of the wire doubled the resistance doubled, there is a slow increase in resistance, the line of best fit runs roughly directly through every point, no anomalous results in this graph to others because as length doubles the resistance doubles too.
I drew lines of best fit to allow myself to look at the results and how they should of looked like.
My scientific knowledge in my planning helped my prediction. I can now say that my prediction matched the results shown in the graphs.
Conclusion:
My conclusion is that as I increase the length of the wire it increases the resistance. This is because, when there is more wire, there are more metal atoms to get in the way of the flowing electrons, that theory is in my scientific knowledge.
My predictions were:
As the wire gets longer, the resistance will increase at a directly proportional rate. So if the length doubles the resistance should double.
Also, I would not be at all surprised if the correlation between the results slightly changes for the last few results. By this I mean that there will be more resistance in the wire later on. I think this will occur because I have learnt that if the temperature of the wire increases, so should the resistance.
All of my results clarify that my predictions are all true. My results were not that accurate, this is due to mistakes that my partner and I encountered during the experiments.
I can say that current decreases when the length of wire increases & increasing the length increases the resistance.
This is because, when the wire is at a longer length, there are more metal atoms to get in the way of the flowing electrons, as I have said in my scientific knowledge.
Evaluating
My experimental procedure worked well, I found it easy to follow and obtained accurate results as I expected.
Most of the points plotted on my graph are close to the line of best fit. This means our experiment was conducted well.
My experiment followed expected results as can be seen by using my prediction, result tables and graphs.
I believe that I have gathered enough evidence to support my conclusion.
Where are the anomalies?
In graph 4, there is one anomaly it is off the line of best fit, I have calculated 1000/length for 11cm (length) to see if my cutting of the wire is wrong.
1000/11= 90.9, 91cm
Therefore this is much more closer to my line of best fit. Therefore I can say that mis-cutting the wire by only one centimetre can have a significant effect later on in my results and graphs.
Ways in which I may of gone wrong:
Inaccurate cutting of wire
Inaccurate results
May not of kept the room temperature at a constant level
The crocodile clips may not been connected to the wire properly
Loose connection
May not of been constant room temperature
Improvements:
· I could also have made the experiment contain more values, e.g. go from 1-5V instead of just 0.50v this would mean I would get more results, and the average result would have been more accurate, as the anomalies wouldn’t affect the results as much.
· An improvement I could have made is to have kept the temperature constant, and made sure of this by keeping the length of wire in a water bath at a constant temperature.
Further Investigation:
- Keeping the length constant but varying the thickness of the wire. Seeing if the resistance or current changes when I use a fat or thin constantan wire.
- I could use different materials like carbon or lead and see if it matters when I change the material.