I used the books: ♣ Encarta Encyclopaedia
♣ Physics for you
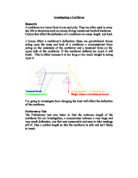
These two books helped me understand Hooke’s law of compression and expansion. While the preliminary work help me to determine a prediction.
Preliminary Work Results: -
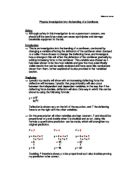
Safety: -
We will have to be safe that the meter stick does not snap especially the in case shards fly out so will be taking minor precautions and shall not be adding ludicrous amounts of weight onto the stick. So I will be put a maximum of 6N on the meter stick.
The Equipment -
The equipment that we shall be using will be checked to see if there is anything wrong with it, for example the meter stick may already has a sleight bend within it. We will have to use the most accurate equipment available to us so we can obtain the most reliable and accurate possible results. Wood is the material that we are using constantly as the meter stick otherwise the deflection will not be the same as using a plastic meter stick, and will also be a regular shape during every test. (Length, height, width)
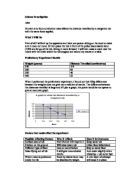
Prediction: -
I predict that the largest weight added will deflect the most due to the fact that the weight has more force in it and thus the meter stick will stretch and compress more than any of the other measurements. I predict that the deflection the different weights cause will result in a noticeable pattern; I predict this because in preliminary experiment with the meter stick we noticed that the deflection went up in pattern. Which means that the force applied will be directly proportional the amount of deflection. The resting position for all three tests of the meter stick is at 0mm.
Results: -
We gathered our results and placed them into a table and onto a line graph (On other page).
Explanation Of Graphs –
The two graphs are the line graphs of the results and the averages of the results. These show a proportion, that the more mass on the meter stick the higher the amount of deflection that occurs, which is Hooke's Law: Force applied is directly related to the amount of deflection. The line of best fit within the graph shows this. This also supports my prediction.
Conclusion: -
I conclude that my prediction that the more weight on the meter stick the more deflection occurs. We noticed a pattern in the amount of deflection.
100g mass - The deflection increases
200g mass - The deflection of 100g doubles (approx)
300g mass - The deflection increases
400g mass - The deflection of 200g doubles (approx)
500g mass - The deflection increases
600g mass – The deflection of 300g doubles (approx)
From these results we can potentially predict the amount of deflection that will occur when any force is applied until it reaches its deflection limit, if we had an extremely accurate measuring instrument.
My prediction matched the result due to an experiment on Hooke's Law which we conducted previously and because the two where connected we could roughly see what the results were supposed to be.
I also did some research using the Internet and found out the formulae for Hooke's Value, this is used for checking proportions.
Hooke's Value= Mass/Extension
In the graph and the tables that have been drawn the value is equal for the distance from the pivot and this shows that the proportion between the weight and the force applied is correct.
Evaluation: -
The experiment worked out to produce good and quite accurate results so we could plot a graph and draw a sensible conclusion. The results obtained were accurate enough but the was a few amorous results obtained when experimenting, this is due to bouncing and the level ness of the ruler used to measure deflection. Overall I thought the experiment was a success due to the fact that the results seemed to be very reliable.