Plan
Equipment:
18 sample bottles
Ruler
Scalpel
Syringe
Corer size 2
Tweezers
Potato
Solutions
18 lids for the bottles
Scales
Paper towels
White tile
Pen
Method:
Step 1: set out equipment. Collect together the bottles, the Syringe, corer, potato, ruler, white tile, scales, lids, pen solutions and scalpel.
Step 2: measure out solutions and put them into each bottle, Start with 0 molar, 0.2 molar, 0.4 molar, 0.6 molar, 0.8 molar and then 1 molar. Measure out 3 of each.
Step 3: label each bottle with the solution in it and a, b or c.
Step 4: take the potato and measure out 18 pieces the same size. First use the corer to core a piece out of the potato, use a smaller corer to get the piece of potato out of the corer. Then use the ruler measure 2cm and the scalpel to cut it that length.
Step 5: weigh each piece of potato and keep the results in a table. The table should have 4 columns.
--------------- = Mass (measure to 2 decimal places of a gram)
Step 6: put each piece of potato into the bottles.
Step 7: measure out the solutions and put them into the bottles and put the lids on or the solution might evaporate.
Step 8: leave for 2 days.
Step 9: take out each piece of potato. Use the tweezers to do this.
Step 10: put on to a paper towel to get rid of excess solution.
Step 11: measure the mass of each piece of potato and record the results in the table.
Step 12: make averages of mass lost and gained.
Step 13: clear away equipment put solutions down the sink and glass ware in the dirty glassware tray.
Step 14: make a graph with the results from averages from the table.
Fair Testing: To make this a fair test I will keep most of the aspects of this practically the same and change only one aspect. I will change the concentration of the solution. The size of the potato, the volume of the solution (10 ml), the type of potato, and the amount of time left in the solution (2 days), and the conditions that they are left in will be kept the same.
Reliability of results: To get a more accurate result I will repeat the practical three times so that I can take an average. This will give amore accurate result.
Accuracy: I will use a corer to measure the width of the pieces of potato. I will use a ruler to measure the length of the pieces of potato. I will use a syringe to measure the amount of solution used. I will use scales to measure the mass of the pieces of potato. I will use a scalpel to cut the potato, this equipment is accurate enough for the practical I am doing. The scale is accurate to 0.00 of a gram, the ruler is accurate to mm, and the syringe is accurate to 0.0 of ml., and the corer gives a size to which the potato will be cut.
Range of data: I am using 6 different solutions ranging from 0 molar to 1 molar. They are needed to plot a useful graph because it gives a range of concentrations to compare to the concentration of the potato and it helps to find the potato’s concentration.
Results table:
G = gain in mass
L = loss in mass
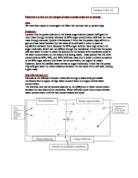
Analysis and Conclusion: I have come to the conclusion that my results were quite reliable. This is because my repeats were quite close together so therefore are more reliable. The reason my results are close together is because of the accuracy of measurements. Also the range of data used was reliable because it was easy to draw the line of best fit. However there were two points which weren’t on the line of best fit, these points are the point for the 0M concentration and 1M. Even though the point for 0M was out it was what I expected. I expected the potato to gain mass, which it did and this is because of osmosis, the difference in concentrations and because there was a higher concentration of water in the solution outside the potato water molecules could pass thought the partially permeable membrane. I expect that the reason the 1M concentration wasn’t on the line of best fit because the line may have started to plateau out. This would be because when the cell is plasmolysed it will have to stop losing water, this will be because the cell can’t totally collapse, so the 1M concentration wouldn’t be on the line of best fit because it had stopped losing water and started to plateau out.
The graph and results table show that between 0M and 0.2M there was a 0.02g gain in mass between 0M and 0.2M. This shows that there was a gain in water in the potatoes in the solutions of 0M and 0.2M. Between 0.2M and 0.4M there was a lost of mass of 0.02g. This shows that there was a loss in mass in 0.2M and 0.4M and this also shows that in the solution of 0.2M there wasn’t much of a loss or gain in mass so therefore there wasn’t much water crossing the partially permeable membrane. Also between 0.4M and 0.6M there was a loss of 0.03g in mass. This shows that water was lost in both these solutions. Also between 0.6M and 0.8M there was a loss in mass of 0.04g. This shows that there was a loss of water in both solutions. Also between 0.8M and 1M there was loss in mass of 0.05g this means that either the result of the 1M is not very reliable or that there is a beginning of a plateau and that the results wasn’t that reliable to show that. The reason there was a loss and gain in mass between the solutions is because of the difference in concentration in the potato and solution and because there is a difference in the solutions the water molecules are able to pass though the partially permeable membrane.
The graph give us the answer to the initial problem and that is what strength solution would it be best to keep potato chips in when just been cut till frying in the morning without losing any water over night. The way in which we can solve this is by looking at where the line crossed the x-axis. The line crosses the axis at 0.36M this means that is the best concentration of the solution to keep the potato in. the reason that this is the best concentraction to keep the potato’s in because at this point there must be the same amount of water passing in and out of the cell. Also this was shown in my hypothesis in that I predicted that the concentration of the solution would be between 0.2M and 0.4M, which it is. This is because 1M is a very concentrated solution and that a cells cytoplasm is a very weak solution of solutes, therefore the solution that is approximately the concentration of the potato will have to be near 0M so it won’t be too strong. Therefore the solution would have to weak so the same amount of water would pass in and out. There also may be a start of a plateau at 0.2M to show that the concentration of the solution was getting closer to the concentration of the potato. The reason that my hypothesis and results are closely linked is because of the research I did before the practical.
Evaluation:
Method: I think the test was reasonable fair because most of the results were close together and the line of best fit was reasonable easy to draw so I think that the results were reliable so therefore the test was fair. However I think that it could have been made more fair by trying to get the mass of potatoes to before closer than they were, because I think that it would matter because it would give results that were really out, and by trying to make sure that the timing was more accurate, however I don’t think that it mattered much. Also to make sure that the amount of solution there is about the same, however I don’t think that that would matter much as long as it covered the potato. I think that the test has to be fair because it would mean that you would be able to get reliable results for the variable that was changed in the test. I think that the range is good, however I think if you were trying to get an even more reliable result for the test it would mean getting rid of the 0M and 1M and home in on the results closer to the result for this test, (e.g. 0.2, 0.25, 0.3, 0.35, 0.4). I think that the only areas are that the mass of each individual potato weren’t as close together as would have been liked (meaning that they would only be 0.01/0.02g out). I think that the aspects of the practical that made the results more reliable were the equipment used, especially the scales and the measuring equipment because it gave really accurate results to 2 decimal places, and the calculations were checked twice by me and the other member of my group, who I did the practical with.
Results: the values of each of the repeats were close together which suggest that the results are reliable. This is because if the results were far apart it would effect the average because when an average is taken each result is added together and then divided by haw many there are, so big/small number can effect the average and therefore if the results are close together that means there weren’t are results effecting the averages. All the results that were taken have been used in the averages. However not all averages have been used in constructing the line of best fit this is because the average for the 1M solution seems to be wrong. The reason for this is that either the result of the 1M solution is not very accurate or that there is a beginning of a plateau and that the results wasn’t that reliable enough to show that. Another reason for the 1M concentration point on the graph to be shown as wrong is because of the positioning of the line of best fit. However I doubt I could of place the line of best fit to show anything different to what is already seen.
Improvements: improvements could be made to the practical to make it more reliable and to give more reliable results on a pacific thing (such as when the line crosses the axes or around the bottom of the results to see whether a plateau is there). To get a more reliable result on certain thing you would have to home in on the solutions that were around that point. Also Ito make the results more accurate you would have to have the mass of potato before closer than it was a collect a more accurate, however in this practical I don’t think it matter much.
Further work: to extend the practical I think a practical to do would be to see if the amount of solution affected the amount of osmosis taken place. To do this you would do the same sort of thing but only use a smaller range of solution and have a few with that solution in and change the of amount solution used. Another practical to do which would provide more evidence would be to get some visking tubing and do the same experiment on that instead of the potato. This would show that there is osmosis between a high and low concentration and that it’s between a parcly permeable membranes. Another practical to extend the information gathered would be to repeat the practical but concentrate the concentrations between 0.2M and 0.4M this would produce a more actuate results.