Method – This is a simple method to understand, and if you follow these instructions carefully you will obtain accurate results-
- Take a stopwatch and a subject to where the stairs are situated, for the experiment to take place
- Take the subjects pulse before the subject performs any exercise.
- Have the subject perform the prescribed exercise (E.g. 30 steps/min)
- Have subject find pulse in one of the places mentioned above, measure for 60secs each time, then give the subject 60 seconds rest.
- Repeat steps 3+4 for additional exercise levels, remember to always repeat each exercise level 3-5 times, as this will help you to identify anomalies results easier.
Equipment –
- Stopwatch
- Subject
- Somewhere to record results
- Stairs
Prediction – I predict that the well person will have a lower pulse compared to the person who is suffering from a Common Cold. I am referring back to my background where I mentioned that the ill person wont be able to breath as well, so will get tired quicker resulting in the heart pumping more trying to get the oxygen around the body to all the cells so they are not starved of oxygen. This results in the heart rate increasing at a rapid rate compared to the ‘well’ person. I will keep the ill person and the well person the same throughout, and will use the same set of stairs and the same stopwatch. However, with the ill person it is vital to get the results on the same day as the ill person could be at a different stage in the illness on the next time of testing.
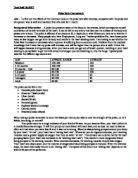
Results Table -
These results were for the subject currently suffering from a Common Cold.
Number Of Steps per min
These Results were for the subject who was fit and well
Number of Steps per min
Bpm – Beats Per Minute
When I undertook my experiment I did not need to change my plan because I found that how I’d planned the experiment was fair, and I believed that the plan would work and it did. I decided that you would try and make the experiment comply with Health and Safety by making sure the experiment was undertaken on the bottom step of the stairs and not at the top in case they subject was to slip, any injury sustained would not be critical e.g. broken legs/arms would not occur. I found this was successful and the two subjects sustained no injuries during the course of the experiment. The only thing I had to change was the person who was well, because the person who was originally going to do it could not find the pulse quick enough, so this would have made it an unfair test if I’d kept her as the other subject. I recorded the results in two results tables, as this was easier to read. I also worked out the averages so that I could plot a graph showing both peoples results so I could compare the results easier than if they were on two separate graphs. I also found that the measurements (No. Of stairs) worked well but was becoming difficult towards the end with the subject having to do 100 sets in 60 seconds. However both subjects managed and I obtained accurate results. I know this as the results went up continuously and showed the same pattern, although the ill subjects were higher.
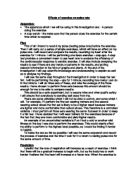
Analysis – My graph shows a steady increase in the time pulse rate, with the different amounts of exercise being performed. Both 1 and graph 2 show results outside of the line, Graph 1 where the result is higher and Graph 2 where the odd result is lower. I was informed that the subject in Graph 2 took her inhaler before taking the pulse, but this was only because she’d put a lot of effort into that one and got out of breath so it resulted in an anomalies result. I was also told she did not use the inhaler again during the experiment but instead waited until the experiment had come to a close. Graph 1 was probably the person put a lot of effort into one, but then realised that they needed to save energy for the rest, so just took the rest at a slow pace. I decided to work out the averages of the results, and plot them in a joint graph (Graph 3) this was done so I could easily compare the two people’s results. I came to a conclusion that my prediction was right and that the ill person had a higher pulse rate throughout the experiment. I have come to this conclusion as it complies with my background information on the front page. I think that if I had been more careful when drawing the graph I could have made the line go through the results. Although there was 1 anomalies result in each persons results, overall the experiment was accurate and fair. Graph 1, the line tends to go up straight and continuous. Where as on Graph 2 the line starts curving round. This is because Graph 2 was for the ill person, and they would have started to get tired at that point in time. This was unavoidable, but it also proves that they would have a higher pulse rate because the heart was pumping faster to get the oxygen around the body, and that they would be working harder.
Calculations- work = force done x distance
Ill person’s weight is 7 stone.
20 steps
Weight in pounds is 98pounds / 2.2 = 44.54Kg
44.54 Kg x (No. Of Stairs x height of stair)
44.54 Kg x (20 x 0.145m) x 9.81 = 1267 Newton/metres
40 steps
Weight in pounds is 98pounds / 2.2 = 44.54Kg
44.54 Kg x (No. Of Stairs x height of stair)
44.54 Kg x (40 x 0.145m) x 9.81 = 2529 Newton/metres
60 steps
Weight in pounds is 98pounds / 2.2 = 44.54Kg
44.54 Kg x (No. Of Stairs x height of stair)
44.54 Kg x (60 x 0.145m) x 9.81 = 3801 Newton/metres
80 steps
Weight in pounds is 98pounds x 2.2 = 44.54Kg
44.54 Kg x (No. Of Stairs x height of stair)
44.54 Kg x (80 x 0.145m) x 9.81 = 5068 Newton/metres
100 steps
Weight in pounds is 98pounds / 2.2 = 44.54Kg
44.54 Kg x (No. Of Stairs x height of stair)
44.54 Kg x (100 x 0.145m) x 9.81= 6335 Newton/metres
Well persons weight is 8 stone
20 steps
Weight in pounds is 112pounds / 2.2 = 50.90 Kg
50.90 Kg x (No. Of Stairs x height of stair)
50.90 Kg x (20 x 0.145m) x 9.81 = 1448 Newton/metres
40 steps
Weight in pounds is 112pounds / 2.2 = 50.90 Kg
50.90 Kg x (No. Of Stairs x height of stair)
50.90 Kg x (40 x 0.145m) x 9.81 = 2896 Newton/metres
60 steps
Weight in pounds is 112pounds / 2.2 = 50.90 Kg
50.90 Kg x (No. Of Stairs x height of stair)
50.90 Kg x (60 x 0.145m) x 9.81 = 4344 Newton/metres
80 steps
Weight in pounds is 112pounds / 2.2 = 50.90 Kg
50.90 Kg x (No. Of Stairs x height of stair)
50.90 Kg x (80 x 0.145m) x 9.81 = 5792 Newton/metres
100 steps
Weight in pounds is 112pounds / 2.2 = 50.90 Kg
50.90 Kg x (No. Of Stairs x height of stair)
50.90 Kg x (100 x 0.145m) x 9.81 = 7240 Newton/metres
Evaluation – My results were accurate, because my graph showed a continuous trend throughout. The line of best fit went up, but like I expected for the ill person and for the well person it continuously went up. I know I had an anomalies result on each graph but this did not really alter my results as the rest were all in line and went up as I expected them to. My procedure was accurate because the approximate range for the pulse is around 60-100 for teenagers (the chart showing this is in my Background Information Section). The ill subjects result for Rest was around 85, so that fits into the Approximate range. The well subjects result for rest was around 70, which also fits into the approximate range, so overall I think I can believe that my test results were accurate, reliable and useful. I could improve my procedure by having a larger number off ill people and well people undertaking a wider range of exercise. I think this would produce more results that if plotted on a graph would be easier to determine better averages and results. This would result in better knowledge of what the pulse rate does when a person is ill during exercise. My method was easy to undertake, that’s why I think I got so accurate results. I also think that using the same ranges of exercise (going up in 20’s to 100) in 60 seconds, but instead testing people who have a range of illnesses, instead of just the Common Cold. I think that extending the amount of steps done in one minute would also give more results, for example doing 120, 140 steps Etc. That would also extend my results and then I could compare the ways that the pulse is affected by different illnesses. Taking more results would result in the Evaluation being Lengthy and I would be able to get you to understand better the structure of illnesses and how they affect the pulse. I believe my experiment was successful, and a lot of information came out of it that I did not know before. This is because before I only believed that the pulse would either increase or decrease, but I did not know which one would happen. Now I have a clear knowledge of the fact the pulse increases during exercise.