Subsequently, when there is more surface area of the potato cylinder, there are more active sites exposed and there is more possiblity of lots of active sites meeting with substrates. The substrates and active sites meeting means that the hydrogen peroxide is broken down quicker increasing the rate of reaction and therefore oxygen produced.
Scientific Diagrams
Equation of experiment
Hydrogen Peroxide + Catalase ----> Water + Oxygen
Apparatus
- Delivery tube
- Stand
- Clamp
- Scalpel
- Tile
- Test tube
- Potato(cut into cylinders)
- Cork borer
- Tap burette
-
Stopwatch(Accurate to + or - ½ second)
- Ruler(Accurate to the mm)
- Measuring Cylinder(Accurate to the ml)
My apparatus is very accurate which will make my results accurate also
Safety
- I will wear gloves to protect my hands
- The form of eye protection will be goggles
Measurement
To get my results I will measure the amount of oxygen(cm₃) produced through using a tap burette.
Variables
Items remaining the same will be; Volume of potato, temperature, volume of hydrogen peroxide and time.
The only item in the experiment that will be changing will be the surface area of the potato cylinder.
Range of results
The range of results will be coming from the changing surface area.
The surface areas are(to 3sf); 21.1cm², 23.4cm², 25.6cm², 27.9cm² and 30.2cm².
The surface areas were worked out using the following formula;
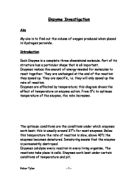
Method
1) I will collect all the equipment
2) The apparatus shown will be set up as in the diagram
3) The tap burette will be filled with water to see how much oxygen displaces it in 3 minutes
4) I will then use a size 6 cork borer to extract the potato cylinder from the potato
5) The potato cylinder will then be placed into a test tube of 20ml of hydrogen peroxide
6) The experiment will be allowed to run for 3 minutes
7) The amount of water remaining in the tap burette will be taken away from the original amount giving me the amount of oxygen produced
8) This will be repeated twice and the results will be recorded and the average will be worked out
9) The experiment will then be carried out with different lengths of the same size potato cylinder which increases the surface area.
Diagram
Intepretation of results
Through reading the line of best fit on my graph, I have realised that as the surface area of the cylinder increases, the volume of oxygen produced increases. This has happened because when there is a large surface area of the potato cylinder, there are more active sites exposed increasing the chance of the active site fitting with the substrate causing the enzyme to break down the hydrogen peroxide.
My graph shows that as the surface area increases, the volume of oxygen produced increases.
Scientific reasons for this are that the active sites are exposed increasing the chance of the active site fitting with a substrate.
Another reason is that the activation energy has been lowered by the catalyst. This means even slow collisions have the chance to overcome the activation energy making the reaction quicker.
The results and the graph have supported my prediction. I predicted that when the surface area increases the amount of oxygen produced will also increases and this is what the results and the graph have shown.
This has proved that my prediction was correct.
The method I used in this experiment was good because it worked out exactly what I needed to work out.
It found out whether the oxygen produced increased when the surface area increased which was exactly what I wanted to work out and therefore it was a good and appropriate method.
However, it was time-consumping and this is something which could be improved if I ever did the experiment again.To improve the problem of time, I wouldn't do the experiment for three minutes next time. Reducing the amount of time would still find out the required information but may not be as accurate.
The potato cylinders could also be cut into smaller than ⅓ pieces to improve my experiment next time. That would give me more accurate results and a much more detailed graph.
There were no anomolous results on my graph proving that overall my method, prediction and experiment were successful.
Because there were no anomalies, I believe my results are fully reliable. I also did each experiment for each cylinder 3 times and worked out out an average. All results for each experiment were close proving that the results were accurate.
They are also reliable because they support scientific reasons as to why surface area and its increase increases the amount of oxygen produced.
However, to make my results as accurate as possible I could do other experiments such as the effect of pH on enzymes. Another experiment to further my results is the effect of temperature on enzymes.
The experiment with temperature would involve me doing an enzyme-controlled reaction at different temperatures to see how temperature affects the rate of a reaction. For example I would see how fast the reaction is going at 10C, 20C, 30C, 40C, 50C and this would show if there is any correlation between increasing the temperature and the speed of a reaction. This could help the experiment that I did because I would have known that temperature can affect the rate of a reaction and therefore I would have controlled the temperature.
The other experiment with pH would have involved me doing an experiment with enzyme solution in different test tubes. The test tubes would have contained an alkali, an acid, water and boiled water. Photographic film containing gelatin will be placed in each of the test tubes. If the gelatin has been digested the film will turn colourless. If the gelatin has been digested the protease would have worked. This experiment will show the effects of pH conditions of an experiment and how pH conditions can affect certain experiments.
This experiment would have helped the experiment I did because I used an acid in my experiment and this could affect what I was trying to find out.