Variables
Input:
- Length of wire. *
- Material of wire.
- Width of wire.
- Starting temperature of wire.
Output:
- Voltage across wire.
- Current in circuit.
- Temperature of wire.
The variable marked with a * will be varied, the other input variables will be kept constant. The output variable marked with a † will be measured.
Predictions
- The longer the wire, the higher the resistance. This is because the longer the wire, the more times the free electrons will collide with other free electrons, the particles making up the metal, and any impurities in the metal. Therefore, more energy is going to be lost in these collisions (as heat).
- Furthermore, doubling the length of the wire will result in double the resistance. This is because by doubling the length of the wire one is also doubling the collisions that will occur, thus doubling the amount of energy lost in these collisions.
Method
The following circuit was constructed to perform the investigation:
wire
The two dots ( ) represent the crocodile clips that were placed at the ends of the required length of wire.
1. One metre length of 0.4mm diameter "constantan" (a metal alloy) wire is fixed to a metre rule.
2. The first crocodile clip is clipped to the wire at the 0cm position on the metre rule.
3. The second crocodile clip is clipped to the relevant position depending on the required length of wire.
4. The power supply is turned on. The voltage and current are then read off the ammeter and voltmeter, and recorded.
5. The power supply is then turned off and the second crocodile clip is moved to the next position.
The above steps are completed for each length and then the entire investigation is repeated for accuracy.
Rough Trials
In order to decide upon the voltage and lengths of wire to use in the final experiment, the following rough trials were carried out:
At 3V:
At 5V:
After performing these rough trials, it was decided that 3V would be used in the proper experiment, as it provided results from 10cm up to 100cm and the higher voltage provided no additional ease of measurement.
Furthermore, it was also decided to allow the wire to cool between experiments as considerable heat was noticed at lower lengths and, as mentioned above, an increase in temperature results in an increase in resistance. By allowing the wire to cool between experiments a fair test could be assured.
Safety
In order to perform a safe experiment, a low voltage of 3V was chosen so that overheating was minimilised. Furthermore, lengths lower than 10cm were not tried, which also helped to avoid overheating.
Results
Wire 1, Set 1:
Wire 1, Set 2:
Having completed two sets of results for one wire, it was noticed that these was a large black mark towards one end of the wire, where it appeared that it had been melted to some degree at some point. It was therefore decided to conduct experiments on an additional piece of wire that was checked for integrity prior to investigation:
Wire 2, Set 1:
Wire 2, Set 2:
Averages for each wire were then calculated to give these results, which were then graphed:
Conclusions
Having performed the investigation, the following conclusions were drawn:
- As predicted, an increase in length resulted in an increased resistance. This can be clearly said for both wires tested.
- Both wires show a strong trend of a straight line, i.e. the length of the wire is shown to be directly proportional to the resistance - double the length and the resistance doubles.
-
The overall resistance of the two wires seems to differ considerably. Due to the strong correlation of the results, the explanation of this is unlikely to be the method used to obtain the results. The more likely explanation would be that the first wire was actually of a larger diameter than the second one. Obviously this is a rather important oversight and this will be discussed more in the Evaluation section. The reason why this is the likely explanation is because resistance is known to be inversely proportional to the cross-sectional area, i.e. if you increase the cross-sectional area (by increasing the diameter) then you decrease the resistance. This is because a wider wire means less likelihood of the free electrons having collisions and losing energy.
It is important to realise, however, that despite the fact that it would appear that the resistance of wire 2 is double that of wire 1, that does not mean that the diameter is half that of the wire 1. That is because if you halve the diameter then you decrease the area by a factor of about 3 (A = πr2)
Evaluation
- As mentioned previously, the biggest downfall of the investigation was the apparent mistakes when choosing the wire, in that they would appear to be of differing diameters. This did not, in this case, cause a big problem as the same wire was used for each set of results so it is known that the results for each wire are correct.
- Generally speaking, wire 1 would appear to contain the most accurate results due to the fact that all of its points bar one sit on the line of best fit for that wire. The only one that does not is the point at 90cm, which was exactly at the point that the black mark (mentioned previously) was found to be.
- Wire 2, on the other hand, had three main anomalous results: at 50, 80 and 90cm. They are by no means that far off but in an experiment such as this, which is generally a very accurate one anyway, such anomalous results should not be quite so common. Possible explanations for these anomalies are as follows:
- The length of wire for that particular measurement was not correct. At 50 and 80cm it is possible that the length was shorter, causing a lower resistance, and at 90cm it is possible that it was longer, causing a higher resistance. The solution to this is to measure the lengths more carefully and ensure that the wire is pulled tight against the metre rule.
- For a particular result, one or more of the connections could have been faulty, causing extra resistance at the connections. A solution to this would be to, before each experiment, connect the connections together without the wire in place and measure the resistance then. If it is higher than it should be then the connections could be cleaned.
- Whilst extremely unlikely, it is conceivable that the power supply was providing a different voltage for some of the results. This is unlikely to be a problem in this investigation but it might have been an issue had we used batteries instead.
NB: If one were to assume that Ohm's Law applies, then another possible explanation could be that at some points (more likely in the lower lengths), the wire was not allowed to cool completely so that the temperature was higher for that measurement. Whilst unlikely (due to the two sets of results), this would cause a higher resistance as explained previously. However, it is now known, after researching the metal alloy "constantan," that the resistivity (the electrical resistance of a conductor of particular area and length) of this alloy is not affected by temperature. Therefore, in these experiments Ohm's Law does not apply.
The Resistance Of A Wire
Planning
Variables
Length of wire:
The length of a wire will affect the resistance because wires have a net of atoms and the electric current has to pass through this net. Every time a charged atom hits the net it loses some of its charge, therefore the longer the wire the larger the chance of the charged electrons colliding with the net and losing some of their charge therefore increasing the resistance.
Width of wire:
The width of a wire will affect the resistance because the wider a wire the more space in the net for the charged electrons to get through without colliding with the net and therefore decreasing the resistance. It is like letting a lot of water out of a small hole; it would go slowly, whereas with a bigger hole it flows out faster.
Temperature of wire:
The temperature of the wire would affect the resistance because as the wire gets hotter the net begins to vibrate because they are given more energy; this therefore makes it harder for the charged electrons to get through the net without colliding with it and causing resistance. Therefore the higher the temperature the higher the resistance.
Material of wire:
The material of a wire would affect it resistance because different materials have different resistivity because the have different nets. Some of the nets may have smaller holes that others and this would increase the resistance because there would be a larger chance of the atoms colliding. Similarly some materials may have larger nets, which would mean that there would be a lesser chance of the atoms colliding.
The variable that I am going to change is going to be the resistance because I think it will be the easiest to change with the apparatus I have available to me and I think it will give fair results.
Research
So far I have taken a lot of information from my G.C.S.E. textbook but some of my work has come from the Internet. I used many different search engines but the two main engines, which I used, were and and here is some of the information, which I got by using these engines:
This information was very useful because the type of wire I am going to use is Nickel Chrome and it has a lot of information on it and it tells me its resistivity.
Prediction
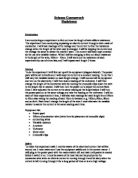
I predict that as the length increases the resistance will also increase in proportion to it. I think this because the longer the wire the longer the net of atoms and therefore the larger the chance of the electrons colliding with the net and losing some of their charge. Therefore if the length is doubled the resistance should also double, because the length of the wire has doubled therefore the amount of atoms will have doubled so the amount of collisions should double. When I draw a graph it should hopefully show that the length is directly proportional to the resistance.
The diagram below should show this more clearly:
Apparatus
Meter rule - to measure out the length of the wire.
1-meter length of nickel chrome wire - to test its resistivity.
Ohmmeter - to measure the resistance of the wire.
Crocodile clips - to connect the ohmmeter to the wire.
Wires - to connect the ohmmeter to the crocodile clips.
Masking tape - to stick the wire to the ruler.
Preliminary Work
I did some tests to see what distance I needed to space my readings at and this is what I got:
My preliminary results have shown that altering the length by 10mm is too little because the resistance gain is too uneven, but if I change the length by too much i.e. 500mm the gap is too large. Therefore I am going to take my results every 50mm. I also found that the wires connecting the ohmmeter to the wire had a resistance of 0.3mm so I will have to
To make it a fair test I need to make sure that I keep all of the other variables the same. I will use the same wire every time and in I will use it again in my repeat experiment, so that the width and material of the wire will remain the same. The temperature of the wire will be very hard to keep constant because each time an electron collides with the net its energy change from electrical to heat therefore every time the atoms collide with the electrons the wire will heat up. Hopefully this will not affect my experiment too much because I am only going up to a meter in length therefore it should not heat up too much.
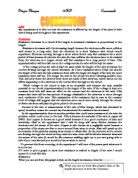
Diagram
My apparatus will be set up like so:
Method
- First I will gather up all the needed apparatus and set it up as above.
- Then making sure that one of the crocodile clips is on exactly 0mm and that the other is on exactly 100mm I would take a reading.
- Before I record the reading I would make sure that the ohmmeter had come to a complete stop and was not flashing.
- I would the repeat this every 50mm until my I got to 1000mm making sure that the first crocodile clip was always on 0mm.
- Then I would repeat the whole experiment making sure that I used the same wires so that the width and material of the wire were kept constant.
- Whilst repeating the experiment I would make sure that I did it in the same place as before because if I repeated it next to a radiator the resistance would go up.
Results
Explanation Of Results
My first set of results has an anomalous result, which is circled on the first graph. This could be because I did not wait for the ohmmeter to settle and I took the reading too quickly. My second and average set of results are good with no anomalous results and they show a definite relation between the resistance and the length of the wir they show that as the length goes up so does the resistance.
In my prediction said that if the length doubles so should the resistance and my first set of results show that at a length of 250mm the resistance was 5.2W and at a length of 500mm the resistance was 10.1W which is very close to my predicted answer.
Conclusion
I think that my experiment went quite well because all my graphs had straight lines showing a strong relationship between the length and the resistance.
But I could have improved this method in a couple of ways. For example I should have used pointers instead of crocodile clips because they are far more accurate, this is because they have a far smaller tip than crocodile clips and they would give a more accurate measurement of the wire. Also pointers would not have compressed the wire like crocodile clips. Crocodile clips have a spring in the to keep them shut and this could have compressed the wire therefore increasing the resistance.
I also should have been more careful about making sure the wire was taught when I took the readings because if it was loose it would have been a longer length that the one I thought I was reading.