Here are the results of my preliminary work:
These results are quite inconsistent; which shows that I will probably need to repeat each experiment more than once in order to obtain accurate results.
The results of my preliminary experiment helped me to decide on what to write for my final method. I have decided that I will need to repeat each experiment three times in order to gain accurate results. I shall take an average of the three results and use these averages when drawing a graph.
Here is how I am going to carry out my investigation:
- Firstly, I will get out the apparatus and set it up as shown in the diagram. (I will take care when handling any glass equipment.)
- Once I have set up the apparatus correctly, I shall place the ball in the beaker and put the Bunsen burner on. When using the Bunsen burner for this investigation, I will use a half flame, because I am heating up a liquid (the water in the beaker).
- I will carefully watch the thermometer so that I will know when the correct temperature has been reached. When that temperature has been reached, I will take the ball out of the beaker using the tongs.
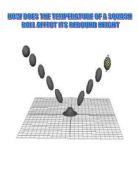
- I will then hold the ball 1m up from the ground. (I will measure this distance using a metre ruler.) I will drop the ball from this height and, as the ball rebounds upwards, I will record the point at which the ball is highest. (I will only measure this to the nearest centimetre, as it would be too difficult to measure it any more precisely.)
Here is a labelled diagram of the apparatus (not shown here are the tongs that were used to keep the ball underwater and to get the ball out of the glass beaker):
I will attempt to make sure that my results are reliable by repeating the experiment for each temperature three times. As I have already stated, the variable that I am going to change for this investigation will be the temperature. In order to ensure that bias is minimal in this investigation, I will need to control all of the other variables. These include the surface that the ball will be landing on, the type of ball (meaning that I will have to use the same ball for each experiment) and the height from which the ball will be dropped. (The surface that the ball will be landing on shall be the table.)
As with all science experiments, I shall have to ensure that it is made safe. I shall do this by making sure that I wear safety goggles at all times (including when I am clearing away all of the apparatus). I shall also make sure that I take care when handling any glass equipment, in case it is dropped and smashed. I will also make sure that bags are placed under the table, because if they were left out, somebody could trip up on them.
Results
(All of the experiments are measured to the nearest centimetre. The average recordings are measured to two decimal places.)
I have shaded in one of the recordings as I have classed it as an anomalous result (it does not follow the trend that I expected).
Graph
Conclusion
Through this investigation, I have found out that, as my prediction states, the general trend is that the temperature is increased, the height of the bounce increases.
However, not all of my results followed this trend. The average recording for 80°C was 59.67cm, which is a higher average bounce than the average bounce for the 90°C recording (59.33cm). If these results were to follow the general trend, the average 80°C recording should have been, in theory, lower than the average 90°C recording.
As temperature is increased, the particles inside the ball gain energy, and so when the ball hits the surface, the particles push against each other; so the ball will bounce high or low depending on how much energy the particles have. (This is only relevant to a certain point, because if the ball gets to a certain temperature it will begin to melt.) This idea is backed up by the trend line n the graph, which shows positive correlation, meaning the height of the bounce does increase with temperature.
Evaluation
I felt that, in general, the experiment went very well, although I was disappointed with the anomalous result.
I think that the reason for this anomalous result is that the experiment was not carried out accurately enough. I feel that if I had tried to make the investigation more accurate, then this disappointing anomalous result would not have come around.
If I were to carry out this investigation again, in order to prevent any further anomalous results, I think that I would have to make certain alterations to the method. For example, I could have made the experiment more accurate by repeating each experiment more than three times each; I could have repeated each one five or six times instead, which would make anomalous results less likely.
Another aspect of this investigation that was inaccurate was in the fact that when I dropped the ball, it sometimes bounced awkwardly against the clamp-stand, meaning I would have to drop the ball again. This happened several times during the investigation. Between the time that it bounced awkwardly and it was dropped again, the ball will have had time to cool down, so the ball may have been at a temperature of 88°C instead of 90°C.
Another inaccurate factor of this investigation was that it was very difficult to see the point at which the ball was highest, so an incorrect recording may have been written down at times. This problem could be resolved if I had a video-camera, so I would be able to play it back and get a closer look at when the ball is at it’s highest point.
I believe that all of these factors that I have mentioned contribute towards explaining the anomalous result in my results table. These inaccuracies also make my evidence unreliable to some extent, although I do believe that the evidence that I have gained from this investigation is reliable enough to confirm my belief in the relationship between the height of the bounce and the temperature of the ball. If I did want to confirm my belief in the trend, I could carry out experiments for more extreme temperatures, for example, 0°C or 110°C, and see if they confirm the trend.