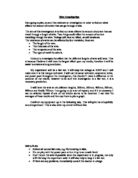
Method
- Set up all the equipment as shown in the diagram above, connect the power pack to a mains supply.
- Begin the experiment with the crocodile clip at 700mm using the meter ruler to measure.
- Turn on the power pack and turn the dial until the voltmeter says 2.00
- Look at the ampmeter and take a precise reading to two decimal places.
- Move the crocodile clip down through the range of numbers, stopping once you have taken the 200mm one.
- Repeat steps one to five.
- Fill in all final results into the results table.
Prediction
I believe that the longer the wire is the higher the resistance of the wire will be. Therefore the current will increase as the length of the wire decreases. We know that this is what will happen because of the equation
V=IR
Therefore we know that
I = V / R
In English this means that Current is equal to the voltage divided by the resistance of the wire, so if the resistance increases as the voltage isn’t moving, then the current will decrease. In reality the resistance and the current are inversely proportional to the other. If the resistance is doubled then if our experiment is fair then the current will half as the two are inversely proportional to each other.
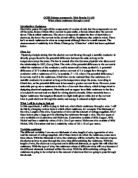
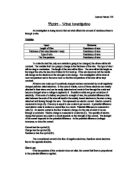
I believe that the current will decrease as the length of the wire increases because as the length of the wire increases then the free electrons moving around inside the wire will find it harder to pass through due to the fact that there will be more nuclei inside the wire for the free electrons to bump into. See diagram one and two.
Diagram One
Diagram Two
As you can see in the second diagram the same number of free electrons are trying to pass through but there are twice as many nuclei for them to get past, which means it is harder so therefore less free electrons get past the nuclei, and more just end up having difficulty getting past the neutrons, therefore as the length of wire increases the amount of current that can pass through gets lower.
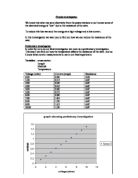
Preliminary Results
I took preliminary results to make sure my experiment would work I also took repeats for these results, as it would be no good to do an experiment that wouldn’t work. I set up my equipment as shown in the circuit diagram earlier, and I got the following results. I took results for 200mm, 400mm and 700mm.
These results were all good results so I continued with my experiment without changing anything. My experiment was showing what we had expected it to. Therefore there was no need to change anything and I continued the experiment.
Obtaining Evidence
I collected my results using the reliable method in my plan. I know it is reliable as I used it for my preliminary results and they all worked as expected. The technique was a fairly simple one however it worked well and gave me only two anomaly’s. This is quite good going as I can explain one and I believe I can explain the second one also. Here are the results I collected during the experiment as well as a column for the average score to 2dp. I have also put down the resistance as this may be helpful later on in the investigation.
* I took a selected repeat for this result, as it was obviously wrong before I took the selected repeat at the end of the other results. This has been included in the table however before we got 0.28 we got 0.73 for 400 mm Run 2.
These results are as far as I can tell accurate and correct; all the results apart from one fitted the pattern, and this I believe was an unfortunate anomaly. However the experiment went well and the results were on the whole correct and accurate.
Analysis
The graph of my results is at the back of the investigation, My graph shows that as the length of wire increases then the current that can flow through it decreses.
To conclude I would like to state that I could make a strong conclusion from my results. This is because most of my results fitted the pattern. This is because my experiment was a fair test. The current passing through the wire increases as the wire length decreases, this is because the resistance and the current are inversely proportional to the other. If the resistance is doubled then as my experiment is fair the current halfed as the two are inversely proportional to each other.
I know that the current decreased as the length of the wire increased because as the length of the wire increases then the free electrons moving around inside the wire will find it harder to pass through due to the fact that there will be more nuclei inside the wire for the free electrons to bump into. You can see diagrams explaining this in my plan.
Therefore my prediction was correct, however there were two anomaly’s in my results, the first was pointed out under my table, I have come to believe that this result was incorrect As it didn’t fit the pattern, I believe that this is because of a unprecedented power surge in our equipment, or in the mains supply. This would explain why our first anomaly is more like 200mm than 400m. However on this anomaly I cannot be exactly sure, however as our experiment was a fair test I believe it must have been a factotor beyond my control which caused this anomaly, therefore I took a selected repeat and continued with the experiment. This third result was a lot more satisfactory than the second so I decided to use this one instead.
My second anomaly was the one which was only noticeable once the results were on the graph. This has been circled in red ink. I believe this is an anomaly as the other results all fit a straight line of best fit, where as this result seems to be trying to turn this line into a curve, however as the results are in inverse proportion to each other then they should be in a straight line. Therefore I believe both the results at 200mm to be anomaly's, this is because the wire was to short at these points and the wire began to get hot, therefore the experiment at these two points was not a fair test. Unfortunately this could not be avoided as we didn’t expect it, therefore we had no idea that this effect would occur. My results nearly perfectly match my prediction, the two which don’t are explained above.
Evaluation
My method was correct and worked well giving me strong results with which I could make a strong conclusion. My anomaly's results have already been thourghly explained in my analysis. My method was correct and there was very little need for improvements, however if I was to do this experiment again I would either do it at a lower voltage, to prevent the second anomaly's, or another way I could prevent them is to begin my results at 300 or even 400mm. this would have definitely sidetracked the problem of the temperature been too high.
Another way I could have improved this experiment is to have used a more protected power supply, or a surge protector, this way the first anomaly could not have occurred as the power pack would have been secure, and no extra electricity could pass through or no surges could have occurred. This way if I had followed the two steps above then my anomaly's would probably have not occurred, and the problems wouldn’t have happened.
A third set of repeats could have made my results more accurate, however I believe two was sufficient and no more were truly needed. This conclusion was a strong one and most of my results were reliable, any that weren’t have been explained already. If I did this experiment again I would change the reliability of my results by using the equipment specified earlier.
If I would have the chance to do this experiment again, I would investigate all four variables, as then I could hopefully produce a stronger conclusion, giving more results and finally comparing the different sets of results and working out what had the biggest effect.
Chris Neal 10mpi