Preliminary results
Apparatus:
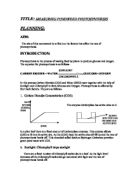
- Gas collection tube to measure length of bubbles produced in certain period of time.
- Funnel, to direct the bubbles into the gas measuring tube.
- Beaker to hold the solution.
- Sodium hydrogen bicarbonate solution.
- Pond weed (16cmlong).
- Lamp
- Ruler
- Clamp
Method
- Fill beaker with 250ml of sodium hydrogen bicarbonate
- Take a piece of 16cm pondweed and put it into the beaker.
- Connect the Funnel the gas measurer and t the clamp.
- Cut the end of the pondweed at an angle (to allow the bubbles of Oxygen to pass through easily) Stick this end into the funnel.
- Put the meter rule 90 degrees to the beaker and to the lamp.
- When the first bubble appears, start the stopwatch.
- Take the reading of the length of the bubble in a time period of 10 mins
- Take readings for 0cm, 5cm, 10cm, 15 cm and 20 cm.
Results
Graph:
Conclusion
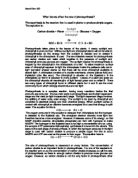
As we can see from my graph, my prediction is correct that as the distance away from the light source increases, the amount of bubbles decreases. This is because as the lamp is moved away, the less the light intensity. If the light intensity is decreased, then the plant has less sunlight to photosynthesize into food and oxygen. That is why the length of the bubble of oxygen also decreases. Since the equation for Photosynthesis is:
Representing sunlight
Co2 + H2O Glucose, ATP and O2
Therefore as the amount of sunlight increases, there are more by-products: Oxygen, ATP and glucose. This means that more sunlight, more oxygen, and more oxygen means the more bubbles there are, adding up to a larger bubble. However, my prediction is incorrect in a way because the limiting factor cannot be identified. In my prediction, I mentioned that the rate of photosynthesis would increase as the light intensity increases only until a certain point where limiting factors such as too much sunlight take place. Sunlight contains I.R rays, and I.R to a certain extent are bad for cells (taken from ). They penetrate cells easily and because Microvibrations. These basically heat up the cells including important Enzymes. As we know, Photosynthesis is an enzyme-based reaction. Also, enzymes denature once they reach certain temperature, meaning they do not function. So if the light intensity is too great (meaning that the I.R is strong) then the enzymes would be heated up and therefore be denatured and no more photosynthesis will take place. Since the plant is a living organism, there is limit to the speed of which photosynthesis can be carried out in the chloroplasts no matter how much supply of water, sunlight and Co2 is supplied to the plant. Also, other factors that are able to affect photosynthesis will limit the photosynthesis from going higher and higher. For example, even if the plant has maximum light intensity, the fact that the Co2 and H20 is kept constant will prevent the plant from further photosynthesizing. I think these limiting factors could not be seen because the light from the lamp was not strong enough to produce so much light intensity and I.R to make the enzymes denature and make the Chloroplasts work at Max rate.
Evaluation
I think that my results are fairly accurate in the sense that it showed that as the distance is increased, the rate of photosynthesis is decreased (because of lower light intensity). However, there was no time to repeat the experiment, therefore I cannot judge if the results were reliable or not. The main problem is that the actual light intensity (LUX) is not incorporated. Therefore I should use a LUX meter to measure the actual light intensity and its relation to the rate of photosynthesis. Also, in this preliminary test, the intervals were slightly too large, therefore the pattern produced by the graph is not as accurate. As we can see, when the distance of the light source from the lamp is 20 cm, you can barely read the result. Therefore the intervals should be from 0,3,6,9,12,15 rather than a much larger 0,5,10,15,20. Also, the way I measured the gas produced was by the length of the accumulated bubbles. Since we are investigating rate, it would be better to use cm cubed per minute, rather than just length (cm) per 5 minutes. If I were to do this experiment again, I would therefore use a cm cubed gas measurer than a cm one. Another point is that too much Sodium hydrogen bicarbonate was used. It was maybe too strong and therefore harmed the plant making the result for 20 cm no photosynthesis at all. Therefore, a better way to do this experiment is to use more water in the sodium bicarbonate solution. I also recorded the results from furthest distance to the closest distance e.g.: from 20cm to 15cm, to 10cm. This makes my results inaccurate because the plant needs time to adapt from a lower light intensity to a higher light intensity. For example, the reading for 0 cm should be higher than it is, because I included the adaptation time in the 10 mins allowed for the plant to photosynthesize. Therefore if I were to do this experiment again, I would take readings from closest distance to furthest distance or either give the plant a slight adaptation time.
Actual Experiment
Apparatus
- Gas measurer
- Beaker
- Sodium hydrogen bicarbonate (100ml)
- Funnel
- Ruler
- Lamp
- Sheet of glass
- Water (150ml)
- Pondweed (16cm)
- Clamp
- LUX meter (to measure light intensity)
Fair test:
In order for the experiment to be a fair test, all the other variables apart from the chosen variable must be controlled. In this case, the chosen variable is light intensity.
- Temperature. In order to keep the temperature constant, I will use a sheet of glass to screen off most of the I.R energy emitted by the lamp. By doing this, then the light intensity is hardly affected (because the glass is transparent) but then the sheet of glass absorbs much of the heat.
- Light intensity. In order to keep the light intensity consistent, the same power light bulb will be used each time. Also, I would try to close the curtains in the room. This is because I want the plant to only photosynthesize from the light emitted from the lamp, and not any extra light that comes through the windows.
- Concentration of Co2 in water. After my preliminary test, I decided to use a weaker Concentration of Sodium hydrogen bicarbonate. I found that the ratio of 3:2 (100ml of Sodium hydrogen Bicarbonate and 150ml of water). Therefore this will be kept constant throughout the whole experiment.
- Amount of water. The amount of water will be kept constant at 150ml.
- Colour of light. In order for my test to be fair, I am using white light all the way through the experiment.
- Different type of plant. For this experiment only Canadian pondweed will be used, and not any other type of pondweed.
- Surface area of the pondweed. If there is more surface area, it is likely to have more chlorophyll and is therefore capable of trapping more sunlight and therefore photosynthesizing more.
Measurements:
In this experiment, the amount of oxygen produced by the plant (due to photosynthesis) will be recorded. I chose to measure this because it is the easiest to measure out of the products of Photosynthesis. The other product it Glucose. As this takes part internally, it is extremely hard to measure. However, The oxygen can simply be measured in cm cubed since we can see the bubbles coming out of the plant. I will measure the time taken for each one of the readings. In order to keep it fair, I would use 5-minute intervals of 3cm each time. I chose 3cm because through my preliminary tests, I realized that if the intervals were over 3cm, then the differences between the results would be too large and therefore make my experiment inaccurate. In the same way, I chose 5 minute intervals because through my preliminary tests, I felt that 5 minutes is enough for the plant to photosynthesize enough oxygen to measure. Also I would measure from the closest distance to the furthest. This is because through my preliminary test, I found out that when we move from higher intensities to lower ones, it is easier for the plant to adapt. It is because when the plant is photosynthesizing at 0cm (first measurement), the high light intensity gets the chloroplasts active and efficient, like a ‘warm-up’. The most important thing is that I measure the oxygen in cm3 rather than cm in the preliminary test. Because we are measuring the rate of photosynthesis (Cm3 /min). I will also repeat the experiment 3 times to get an accurate result.
Diagram:
Method:
- Fill beaker with 150ml of water and 100ml of sodium hydrogen bicarbonate.
- Take a piece of 16cm pondweed and put it into the beaker.
-
Connect the Funnel the gas measurer (cm3) and the clamp.
- Cut the end of the pondweed at an angle (to allow the bubbles of Oxygen to pass through easily) Stick this end into the funnel.
- Put the meter rule 90 degrees to the beaker and to the lamp.
- When the first bubble appears, start the stopwatch.
- Take the reading of the length of the bubble in a time period of 5 mins
- Take readings for 0cm, 3cm, 6cm, 9 cm, 13cm and 15 cm.
- Repeat experiment for 3 trials.
Results:
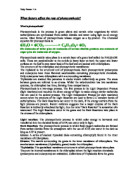
Analysis and conclusion: Through this, we can see as distance increases, light intensity decreases and therefore so does the rate of photosynthesis. This proves my prediction correct. The rate of photosynthesis as the distance increases because as the distance increases, the light intensity decreases, giving the plant less light to photosynthesize therefore lessening the rate of photosynthesis since sunlight is the source, which the plant needs to produce energy, glucose and oxygen. This can be proven with the equation:
Representing sunlight
Co2 + H2O Glucose, ATP and O2
(Equation taken from Biology for you textbook, by Gareth Williams).
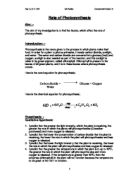
Through this, we can see that a plant cannot produce ATP when there is no sunlight and therefore has no energy to carryout active transport and would therefore die. If we can say that sunlight helps to make the energy in a plant, then it is also logical to say that when there is more sunlight, more energy is produced. When energy is being produced it means Photosynthesis occurring, so we can immediately make the assumption that if there is more energy when there is more sun light, and when there is more photosynthesis when there is more energy, so when there is more sunlight, there must be more photosynthesis. However, as I am measuring distance, then it is correct to say that as the distance increases, the light intensity decreases. So this means as the distance increases the rate of photosynthesis decreases. But the rate of photosynthesis does not decrease a proportional rate. It is inversely proportional squared (taken from . This means that as the distance increases at a rate of x1, the light intensity is decreasing at a rate of y2. If we look at fig.1, which is a graph of distance vs. Light intensity, we can see that the shape is the same as the graph distance vs. photosynthesis. Through this, we can see two things.
1. Light intensity is the factor that controls the rate of photosynthesis and not the distance of the lamp. Since photosynthesis acts upon the light intensity and not the distance.
2. My prediction is still correct because the rate of photosynthesis almost decreased exactly when the light intensity decreased and increased when the light intensity at the same rate of y2.
However, my results are incorrect in a way because the limiting factor cannot be identified. In my prediction, I mentioned that the rate of photosynthesis would increase as the light intensity increases only until a certain point where limiting factors such as too much sunlight take place. Sunlight contains I.R rays, and I.R to a certain extent are bad for cells (taken from ). They penetrate cells easily and because Microvibrations. These basically heat up the cells including important Enzymes. As we know, Photosynthesis is an enzyme-based reaction. Also, enzymes denature once they reach certain temperature, meaning they do not function. So if the light intensity is too great (meaning that the I.R is strong) then the enzymes would be heated up and therefore be denatured and no more photosynthesis will take place. Since the plant is a living organism, there is limit to the speed of which photosynthesis can be carried out in the chloroplasts no matter how much supply of water, sunlight and Co2 is supplied to the plant. Also, other factors that are able to affect photosynthesis will limit the photosynthesis from going higher and higher. For example, even if the plant has maximum light intensity, the fact that the Co2 and H20 is kept constant will prevent the plant from further photosynthesizing. I think these limiting factors could not be seen because the light from the lamp was not strong enough to produce so much light intensity and I.R to make the enzymes denature and make the Chloroplasts work at Max rate.
Evaluation:
My results were reasonably accurate for both the light intensity and the Photosynthesis results. However, there were a few anomalies for 12cm, 14cm in the light intensity graph, and near the 9cm region for the distance graph. However, on the whole these anomalies did not affect the pattern of the graph and a firm conclusion could be made. However, I think that the experiment could be improved. Even though my prediction was that the graph would turn out as a negative curve, I think it would have been better if I had used Light intensity vs. Photosynthesis. This is simply because it is easier to measure. If we look at a curve, it is harder too spot the anomalies. However, if it is a directly proportional straight line, then the anomalies can be easily spotted and identified. However, the LUX meters could not detect a LUX reading over 19000 so then it was hard to measure the light intensity for 0 and 3 cm. In result I should have started measuring further away from the plant so that I could use light intensity instead. Also, the experiment is about light intensity vs. rate of photosynthesis, so it would be more relevant and clear to directly use light intensity rather than distance. Further more, I think the lamp in the experiment was not strong enough to allow the limiting factors to take place. Therefore I cannot identify them from my results. Therefore if I had to repeat the experiment, I would use a stronger light bulb. The bulb itself is about 3 inches away from the lamp-head, this means that when my results was recording 0cm, it actually meant 3 inches. This issue is very hard to improve, provided that we can take off the head of the lamp. Also, it was hard keeping the classroom pitch black so that the plant is only photosynthesizing the light emitted from the lamp itself. Also, everyone in the classroom is working close to each other, in result the plant I was working with may have photosynthesized the extra light emitted from other lamps around the room. So if I had to do the experiment again, I would do it by myself in a pitch-black room, to ensure that no extra light is affecting the rate of photosynthesis. Since the repeat experiments were conducted on different days (with different climates) then the variables have automatically changed. E.g. it was a hot day, then the classroom temperature would rise and enzymes in the plant would work at a different rate. If it was a sunny day, there would be more light seeping through the windows and this would also affect the rate photosynthesis. If I were to further investigate into this investigation, I would investigate the carbon dioxide concentration factor. Since Co2 is another element that plant needs in order for photosynthesis to occur. This is much easier to measure compared to light, and can produce just as accurate results.