Prediction
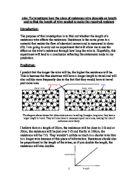
I predict that the resistance will increase as the length of wire increases. The longer or thinner the wire is, the higher the resistance. This is because in the thinner/ longer wire the particles are a lot closer together so that the movement of the current is hindered.
I will record my results on a graph and will look to see if my results are proportional. I predict that my graph will go in a steady relatively straight line . If there are any anomalous results I will know that my experiment has not been 100% accurate.
Plan
I have chosen to investigate the increase in resistance against that of the wire so I can find how much is needed to produce a resistance if 10 Ω. It would also be too difficult to accurately measure the diameter of the piece if wire.
I will set up a circuit like the one on the previous page, making sure that the power pack is set to 3 Volts, the voltmeter is in parallel to the circuit and the wire is securely fastened to the ruler using tape. This will ensure that the ruler is at its full potential length and to stop the wire from braking and or twisting. I will place the wire a few centimetres longer than the ruler so that the crocodile clips can make a sufficient connection and so that the circuit is complete.
For my preliminary experiment I will move the wire connecting the voltmeter every 10cm and then I will take a reading from both the voltmeter and the ammeter ( they will both start at 0) .I will then record these results in a table like the one below;
I will use the resistance calculation to work out the resistance every 10cm
The units that I will use are ohms (Ω). The general rule of Ohm’s Law is,“ The current flowing in a metal wire is proportional to the potential difference across it providing that the temperature remains constant.”
Fair Test
I will make sure that the current remains the same so that the wire does not heat up causing the particles to gain kinetic energy. This would make the particles vibrate and the resistance in turn would be higher. I will also keep the change in length the same each time I move the so maintain an unbiased result.
When I have calculated my results I will workout how much wire is needed for 10Ω.
Safety
The current must not be too high as the wire could get very hot ( it could melt the wire). You should not lean on the ruler or the wire as the wire particles will gain K.E causing an increase in heat. It is also dangerous as the wire has an electric current flowing through it and there may be a risk of getting an electric shock.
Ohm’s Law
The general rule of Ohm’s Law is;
“ The current flowing in a metal wire is proportional to the potential difference across it providing that the temperature remains constant.”
I will now record my results
My First Results
I will now draw a graph (see graph paper)
I will then draw a graph. This graph will give me an idea whether or not I need to change the voltage and / or move increase the wire by a shorter length more frequently.
My first result was not really accurate compared to my conclusion as the results were not proportional and there were a number of anomalous results. I will not repeat the same experiment only this time I will increase the length by 5 cm each time and I will also increase the current to 1.5 (I) to see if I can get a clearer result, which will agree with my prediction.
Second Result
Conclusion
From looking at graph one I can see that it is not 100% accurate as there are 5 anomalous results. It does agree with my prediction that the resistance will increase as the length of wire increases. On the whole the increase is steady e.g. 100 cm of wire gave 23.3 Ω and 50 cm of wire gave 12.0 Ω which is almost proportional.
To produce a resistance of 10 Ω I would use the wire the length of approximately 41 cm.
From looking at my second graph I can see that it is a lot more accurate as there are no anomalous results. The increase of resistance is almost proportional against the length of wire used e.g. 100cm of wire gave 14.0 Ω and 50 cm gave 7.3 Ω which has only a 0.3 variation compared to the 0.7 variation of graph one.
To produce a resistance of 10 Ω I would use a wire the length of 70 cm compared to the length of 41 cm in my preliminary experiment ( difference of 29 cm). This is due to the 0.35 (I) increase that I changed to conduct the second experiment.
Evaluation
My results are quite reliable as they agree with my prediction. From looking at both graphs I can see that my results are not 100% accurate . In graph one I have 5 anomalous results and in graphs two and one the results are not exactly proportional. This inaccuracy could have been caused by experimental error e.g.
- I used two different power packs as I did the experiment over two lessons, so it is possible that one of the power packs was not correctly set to 3V .
- The temperature could have increased due to an accidental increase in voltage, causing the particles in the wire to gain kinetic energy also causing an increase in temperature.
- I may not have left enough wire to be attached to the crocodile clips when sticking to the metre rule, which could have resulted in an insufficient connection.
- The length of the wire could have had a twist in it/ it may not have been measured accurately.
- It was not possible to accurately measure the diameter of the wire.
- It is possible that I did not take the readings accurately as the ordinary volt/ammeters only give readings to 2 decimal places.
My results could have been more accurate if in would have had access to the following equipment;
- A Digital voltmeter
- A Digital Ammeter
I could extend my investigation by taking more readings and plotting these results in more graphs and comparing these results to someone else’s.