Some of the bonds in the protein strand are polar and as a result have a slight charge at one end. H groups are positive and become attracted to the slightly negative O end of OH groups. As the protein has already uncoiled the H and OH groups are free to line up and the result is new hydrogen bonds. This causes the structure to become more compact and the regular arrangement of molecules blocks the light and turns the albumen opaque.
In a trial experiment, a test was carried out to determine which variables needed to be independent and which were needed as controls. In doing so, the local environment was kept the same and equal volumes of different concentration Copper (II) Sulphate were added to a consistent amount of egg albumen. These were then tested in a colorimeter, to measure % light transmission and hence opacity of the solution. This was continued until the solution became completely opaque and so full denaturation had occurred. These prior tests helped in showing an approximate result (0.01) that can be used to design a further experiment more accurately and helped decide which concentrations to test.
I predict that as the concentration of CuSO4 increases the precipitate will become thicker and so will absorb more light and hence the % light transmission will be less.
Apparatus:
- Egg albumen (20cm3)
- 0.1 mol-dm3 Copper (II) Sulphate solution (20cm3)
- 8 Boiling tubes, test tubes and cuvettes.
- Colorimeter with filter
- Distilled water (80cm3)
- 10cm3 plastic syringes
- Dropping pipette
- Glass marker pen
Method:
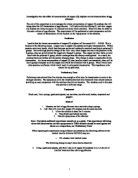
- Eight boiling tubes will be set up in a rack. In the first, will be added 2cm3 of 0.1 mol-dm3 CuSO4 solution and in the last 2cm3 of distilled water, using a plastic 10cm3 syringe.
- In the remaining test tubes, CuSO4 and distilled water will be added as in the amounts given in the table below, to give the different concentrations of Copper (II) Sulphate shown in the last column.
- 2cm3 of egg albumen will be added to eight test tubes. From each of the eight boiling tubes prepared, 2cm3 will be taken using a syringe and added to the egg albumen. Using the thumb on top of the tubes, each will be agitated and then left for five minutes.
- After this, they will all be transferred to a cuvette and tested using the colorimeter. After each time, the colorimeter will be reset with distilled water, which has complete transparency, so the reading reads 100. Each tube will be tested against this and recorded.
- The whole procedure will be repeated twice.
Risk Assessment: CuSO4 is corrosive so care should be taken when handling it and using it during the practical. As it is an irritant, its use should be within practical reason. Labcoats and goggles should be worn to protect eyes and clothes.
Considerations: Variables –
- Independent – concentration of Copper (II) Sulphate solution
- Dependent - % transmission through egg albumen and varying Copper (II) Sulphate solution
- Control – The same amount of egg albumen will be used every time. The colorimeter will be reset so it reads 0 for distilled water before every reading. The local environment is to be kept constant throughout. A solution of just distilled water and of concentrations below that anticipated is also to be tested with the egg albumen to show that it was indeed the lowest concentration needed for full denaturation
Accuracy – Filter colorimeters perform accurate colour measurements only when they measure broadband sources that are spectrally similar to the light source used to calibrate the colorimeter. "http://www.jyhoriba.co.uk/glen/photo_research/images"
As described earlier, this will be the case, and so the accuracy of the colorimeter should be very high.
All other equipment has been chosen to increase precision. E.g. a larger syringe may have made it easier to obtain more solution when high amounts are involved but the same one is used throughout as it is smaller and the readings are closer together.
Reliability – The experiment is to be conducted three times, with the mean results calculated overall to use in a graph for interpretation. This way, any significant differences between results can also be investigated.
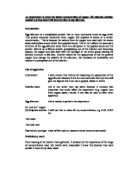
The results will be recorded in a table as below:
When the average figures are calculated they will be presented in a graph as shown below.
From this graph, we will be in a position to determine the lowest concentration needed to fully denature the egg albumen, by reading off the graph from left to right, to the point at which the transmission falls to meet the x axis, and hence the lowest concentration needed for full denaturation.
References
Cornell University, Ithaca
Proteins Under Pressure
http://216.239.37.100/search?q=cache:4CGV8C6v2RsC:bigbro.biophys.cornell.edu/research/High_Pressure/prospectives_poster.pdf+protein-structure-is&hl=en&ie=UTF
Jobin Yvon Hyboria –
Specialists in spectroscopy-
Structure of proteins
OCR Advanced Sciences Biology 1
Cambridge University Press