Main Method
Before I start my main experiment I have chosen to do a risk assessment which is shown below.
Risk Assessment:
"h I will handle the power supply carefully.
"h I am going to only use a voltage of 2 volts.
"h I will be careful when handling live wires.
Apparatus: Power Supply
Ammeter
Voltmeter
Thin Constantin wire
Meter Ruler
Crocodile Clips
Connecting Wires
I have chosen to use thin constantin wire because from my preliminary results I found that this wire had the highest resistance, because it has the highest resistance it will be easier to measure any change in resistance.
To collect the data for my graph I have chosen to take a range of 5 lengths. I have chosen a range of 5
as to plot an accurate graph I will need at least 5 points to mark on the graph . I have also chosen to
take 3 repeats at each length and then take an average. I have chosen this so that if I have any
anomalous results they will not show when I plot the averages on the graph. The lengths that I have
chosen are as follows : 20cm , 40cm , 60cm , 80cm and 100cm. I have chosen these lengths because
they are easily measured by the meter ruler and give a good range.
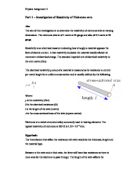
Below is a circuit diagram of the circuit I am going to use in my main experiment:
POWER SUPPLY
2 VOLTS
AMMETER
VOLTMETER
CROCODILE CLIPS
WIRE
METER RULER
In my main experiment instead of using an ohmmeter I have chosen to use an ammeter and voltmeter ,
I have done this so that instead of relying on the ohmmeter to give the resistance I will calculate the
resistance of the wire , I shall calculate the resistance of the wire using the equation below.
RESISTANCE = VOLTS
AMPS
I have chosen to use a meter ruler because the lengths that I will be measuring are to big for a smaller
ruler and also the meter ruler can be accurate to +1mm or ¡V1mm.
Results
SWG
(thickness/mm) Voltage/volts Current/amps V/I=R/ohms Average R/ohms
22
(0.71) 0.2 0.29
0.28
0.29
0.28 0.69
0.71
0.69
0.71 0.70
24
(0.56) 0.2 0.23
0.24
0.24
0.24 0.87
0.83
0.83
0.83 0.84
32
(0.28) 0.2 0.09
0.08
0.08
0.08 2.22
2.5
2.5
2.5 2.43
36
(0.20) 0.2 0.04
0.04
0.04
0.05 5
5
5
4 4.75
Thickness investigation (Length kept constant at 15cms)
Graph 1 - relationship between the wire's thickness and its resistance
Length/cm Voltage/volts Current/amps V/I=R/ohms Average R/ohms
100 0.1
0.2
0.3
0.4
0.5 0.04
0.08
0.13
0.17
0.22 2.50
2.50
2.31
2.35
2.27 2.386
90 0.1
0.2
0.3
0.4
0.5 0.04
0.09
0.14
0.19
0.24 2.50
2.22
2.14
2.11
2.08 2.21
80 0.1
0.2
0.3
0.4
0.5 0.05
0.10
0.15
0.21
0.26 2.00
2.00
2.00
1.90
1.92 1.964
70 0.1
0.2
0.3
0.4
0.5 0.05
0.11
0.17
0.23
0.29 2.00
1.82
1.76
1.74
1.72 1.808
60 0.1
0.2
0.3
0.4
0.5 0.06
0.13
0.20
0.26
0.33 1.67
1.54
1.50
1.54
1.52 1.554
50 0.1
0.2
0.3
0.4
0.5 0.07
0.15
0.22
0.30
0.38 1.43
1.33
1.36
1.33
1.32 1.354
40 0.1
0.2
0.3
0.4
0.5 0.09
0.18
0.26
0.36
0.44 1.11
1.11
1.15
1.11
1.14 1.124
30 0.1
0.2
0.3
0.4
0.5 0.1
0.21
0.32
0.43
0.54 1.00
0.95
0.94
0.93
0.93 0.95
20 0.1
0.2
0.3
0.4
0.5 0.15
0.26
0.40
0.54
0.67 0.67
0.77
0.75
0.74
0.75 0.736
10 0.1
0.2
0.3
0.4
0.5 0.17
0.34
0.50
0.68
0.85 0.59
0.59
0.60
0.59
0.59 0.592
Length investigation (Thickness kept constant at SWG24)
Graph 2 - relationship between the wire's length and its resistance
After doing the two graphs I have decided to do a graph of 1/thickness2, to see if thickness is inversely proportional to resistance.
Thickness/mm 1/Thickness2 Average resistance/ohms
0.71 1.98 0.7
0.56 3.19 0.84
0.28 12.76 2.43
0.20 25 4.75
Investigating thickness2 and resistance
Graph 3 - relationship between the wire's thickness2 and its resistance
EVALUATION
I obtained my results by setting up the circuit show in the diagram on the previous page. I moved the crocodile clips in 10 cm increments and read the voltage off the digital voltmeter. I repeated the experiment twice more and then calculated an average voltage. I then calculated the resistance by dividing the current (2 amps) by the average voltage. This method of calculating resistance is known as Ohm's Law.
From my graph, I can see that my results were accurate. All the points are very close or on the line of best fit in a positive correlation. There were no anomalous results.
As I obtained accurate results, I think that the method I used was suitable.
However, there are certain improvements I could make to improve the accuracy, namely:
· Making sure the wire is straight so measurements could be taken accurately.
· Making the wire straight would enable more accurate positioning of the crocodile clips, which again would give more accurate results.
· Letting the wire cool down sufficiently in between readings. When the wire heats up, it has lots of energy, which causes the atoms in it to vibrate, making it harder for the electrons to travel. This increases the resistance via another method, so it is not a truly fair test.
As I have previously stated, my results have a good standard of accuracy. This is shown by the points being near or on the line of best fit and there were no anomalous results. Therefore my results support a firm conclusion that the length of wire is proportional to the resistance.