Flow Rate, Q
This was then measured by allowing a cylinder of volume 25ml, to be filled in a certain time. The time was collected using the stop watch. By converting the volume to cubic metres and dividing this by the time in seconds, the flow rate is calculated.
Q = volume
time
= 25/ 1000000
25.93
= 9.6413 x 10⁻⁷ m3s-1
Viscosity, η
This can be calculated using Poiseuille’s Law, which concerns the stationary flow of incompressible uniform viscous liquid through a cylindrical tube with constant circular cross-section. It is defined by:
Q = πr4 x ΔP
8ηl
π = 3.14159265358979
r = radius of glass capillary = 0.000575m
ΔP = 5091.39Pa
l = length of glass capillary = 0.268m
Q = 9.6413 x 10⁻⁷ m3s-1
Therefore by transposing the formula, the viscosity can be calculated:
η = π x (0.000575)4 x 5091.39
8 x (9.6413 x 10-7) x 0.268
= 1.74846771 x10⁻⁹
2.06709 x10-6
= 8.45857567 x10⁻⁴ kg / m s
Mean and Standard Deviation of the Viscosity, η
The sum of all the viscosity values is:
Σ η = 8.7024527 x10⁻³
Therefore the mean value of viscosity can be calculated by dividing the sum by the number of values obtained:
μ = Σ η
n
= 8.7024527 x10⁻³
10
= 8.7024527 x10⁻⁴
The standard deviation was calculated using Excel and gives the following value from the obtained values of viscosity:
σ = 4.33854 x10⁻⁵
The mean of the viscosity to one standard deviation is calculated by:
μ + σ
Therefore the range is:
8.7025 x10⁻⁴ - 4.33854 x10-5 = 8.2686 x10⁻⁴
8.7025 x10⁻⁴ + 4.33854 x10-5 = 9.1363 x10⁻⁴
[8.2686 x10⁻⁴, 9.1363 x10⁻⁴]
This proves, from the values obtained in table 1, that they lie in 68% of the mean and show a normal distribution.
The mean of the viscosity to two standard deviations is calculated by:
μ + 2σ
Therefore, here the range is:
8.7025 x10⁻⁴ – 2(4.33854 x10⁻⁵) = 7.8347 x10⁻⁴
8.7025 x10⁻⁴ + 2(4.33854 x10⁻⁵) = 9.5702 x10⁻⁴
[7.8347 x10⁻⁴, 9.5702 x10⁻⁴]
Therefore, all ten values lie within 95% of mean, showing quite accurate date under this distribution, with out any extreme anomalies.
Percentage uncertainties of recorded results.
The Heisenberg uncertainty principle states that one cannot assign, with full precision, values for certain pairs of observable variables. This would also apply to this investigation where we have uncertainties to the readings taken. All readings would have these uncertainties above and below the reading.
To find the percentage uncertainty we apply the following formula.
% uncertainty = uncertainty x 100
reading taken
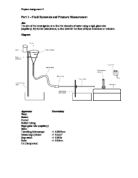
Apparatus
Travelling Microscope
Ruler
Measuring Cylinder
Stop watch
Uncertainty
+/- 0.0005cm
+/- 0.05cm
+/- 0.5cm3
+/- 0.005s
Reading Taken
0.115cm
51.9cm
25cm3
25.93s
Travelling Microscope
This was used to take measurements for the bore of the glass capillary. This was done prior to the investigation.
% uncertainty = +/- 0.0005 x 100
0.115
= +/- 0.435 %
Metre rule
The rulers were used to measure both the height of the desk to the water level mark and also the height of the desk to the horizontal glass capillary. As the uncertainty of one ruler is +/- 0.05cm, therefore the overall uncertainty would be = 0.05 + 0.05 = +/- 0.1cm
% uncertainty = +/- 0.1 x 100
51.9
= +/- 0.19 %
Measuring cylinder
The volume of water was measured using this cylinder. The volume was kept constant at 25cm3.
% uncertainty = +/- 0.5 x 100
25
= +/- 2 %
Stop watch
This measured the time taken for the water to fill the measuring cylinder. The time was taken to a hundredth of a second.
% uncertainty = +/- 0.005 x 100
25.93
= +/- 0.019 %
Graph 1, drawn using Microsoft Excel, is shown on the next page.
Graph 2, drawn by hand, on the page following graph 1.
Gradient of the slope from Graph 1
Knowing Poiseuille’s law as:
Q = π r4 x ∆P
8ηl
A gradient of a linear slope is the division of the change in y by the change in x.
Gradient, m = change in ‘y’ coordinate
change in ‘x’ coordinate
According to graph 1, the y- axis is the change in pressure and the x- axis is the change in flow rate.
Gradient = ∆P
Q
Therefore looking at Poiseuille’s formula, and transposing it so that it equals the gradient, we have:
∆P = 8ηl = gradient
Q π r4
Therefore the gradient of the graph is 8ηl also known as the resistance to flow.
π r4
Resistance to flow of a liquid can be characterised by the viscosity of the fluid if the flow of this fluid is smooth.
From Graph 1, the gradient = 5.490608 x10⁹
l = length of glass capillary = 0.268m
π = pi
r = radius of glass capillary = 0.000575m
5.490608 x109 = 8 x η x 0.268
π x (0.000575)4
η = 5.490608 x10⁹ x π x (0.000575)4
8 x 0.268
= 8.794616 x10⁻⁴ kg / ms
The accepted value for the viscosity of water, according to American Society for Testing and Materials (ASTM) is 1.0020 centipoise, cP. To compare the value obtain and the accepted value, they must be in the same units. Below is the obtained value, converted into centipoise.
1 poise = 100 centipoise = 1 g/(cm·s)
η = (8.794616 x10-4) x 1000
100
= 8.794616 x10⁻³ poise x100
= 0.8795 cP
When using Poiseuille's law to work out the viscosity of water, using the obtained results it was calculated to be 0.8795 cP. This in comparison to the accepted value is about 12% out. This small error can be due to materials used and human error during the course of the experiments.
Reynolds Number
This number is the ratio of inertial forces (resistance) to viscous forces and is used for determining whether a flow will be laminar or turbulent. It is the most important dimensionless number in fluid dynamics. The formula to calculate this number is below.
NR = 2rvρ If NR is above 2500, the flow is turbulent.
η If NR is below 2000, the flow is laminar.
r = radius of glass capillary = 0.000575m
v = velocity of fluid
ρ = density of water = 1000 kg m-3
First of all the velocity must be calculated, as this is required in the above equation. To calculate the velocity, the flow rate must be divided by the area of the capillary.
V = Q = Q_ _ Q = Flow Rate
A πr2 A = πr2 = area of capillary
V = 9.6413420748E-07
π (5.75 x10⁻⁴)2
V = 9.6413420748E-07
1.038689071E-06
V = 0.9282221546ms-1
Therefore Reynolds number is as follows.
NR = 2rvρ
η
NR = 2 x 5.75 x10-4 x 0.9282221546 x 1000
8.689131045E-04
NR = 1.067455478E-03 x 1000
8.689131045E-04
NR = 1.228495085 x 1000
NR = 1228.495
The Reynolds number calculated above, as 1228.495 is below 2000. This confirms that the velocity of fluid flowing through the glass capillary has not exceeded the critical value. This shows that the flow of the water through the capillary is laminar.
Viscosity
The values of viscosity obtained in this investigation have been proportional to the height of water set up. The viscosity increased as the height was increased. There were anomalies found, for example at the height of 62.3 cm, there was a decrease in time and this in effect caused a decrease in the viscosity. This is due to human error and uncertainties of the readings taken. Reaction time of a person is also an error which has not been taken into account. Such as when measuring the time for the rate of flow of water, one person measures the water and has to say start and stop, whilst another listens and presses the buttons accordingly on the stop watch.
The mean value of the viscosity is a good form of examining the average as the data did lie within certain percentiles of the normal distribution. Although the gradient of the graph gave a different value for the viscosity than that calculated from the raw data, it was a miniscule difference as the numbers are so small, being to the standard form of -4. The difference of these two values was 1%, showing heavy closeness. Graph 1 was drawn to much more accuracy of values, as well as ensuring the regression line passes through the origin. This was done because Poiseuille’s law says that at zero height of water fluid, there is zero pressure, and therefore no resistance to flow. For graph 2, this was not possible, and so it would cause heavy errors when calculating resistance to flow, and thus the viscosity would have been inaccurate.
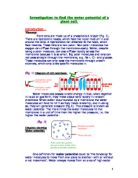
Constituents of blood
Approximately 45% of the blood volume is cells; this includes white cells, platelets and mostly red cells. Plasma makes up the rest of the blood, of which 95% is water. This also contains nutrients such as glucose, fats, proteins, and the amino acids needed for protein synthesis, vitamins, and minerals.
Poiseuille’s formula is good at predicting flow with fluids that are homogenous, (where all the particles of the fluid are of molecular size) such as water. Though it can only offer approximations for non-homogenous fluids as it contains molecules of different sizes, such as blood. Viscosity can also be influenced by the concentration of blood cells, if the concentration of blood cells is very high, the viscosity increases up to 5 times that of normal blood.
This law also predicts a linear relationship between blood flow and pressure gradient. It is not found to be correct as the blood vessels are composed of elastin and collagen, which are elastic elements and stretch under pressure and so the vessel offers less resistance to flow than if it were a rigid tube. Under normal conditions the flow of blood in the aorta is laminar, where v = 0.3ms-1. However, during heavy exercise the velocity can increase five times more and the flow becomes turbulent.
Conclusion
Carrying out this investigation, confirms Poiseuille’s law for the viscosity of a fluid. It also proves how there are certain factors to be taken into account when using this formula. These factors include the pressure difference, the diameter/ radius of the tube and thus the flow rate of the fluid. There being this number of factors affecting Poiseuille’s Law leaves room for error, as there has been in this investigation. Human error is quite significant and accounts for most of the anomalies that occurred. If there were more time, further precautions could have been taken to improve the investigation, and cut out certain sources of error.
Studying Poiseuille’s law, it is clear that there is this relation between the height, flow rate, pressure, radius and length. The radius and the length of the capillary were kept constant, though as the pressure increases; it would cause an increase in the viscosity. Also as the flow rate increased, it would cause a decrease in the viscosity. The flow was found to be laminar, though if there were more time to further the investigation there is a possibility the flow may have developed into turbulence.
Bibliography
http://encarta.msn.com/media_461516365/Constituents_of_Blood.html
http://hyperphysics.phy-astr.gsu.edu/Hbase/pfric.html