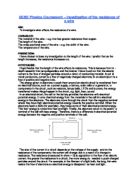
As the electrons in an electrical current move around a circuit, they bump into the atoms in the wires through which they pass. In my case, the longer the wire of an electrical circuit, the greater collisions into atoms, therefore, there is higher resistance.
Here is a model illustrating resistance in a metal:
The Ohms Law states that the current passing through a wire (or resistor) at constant temperature is proportional to the potential difference, a high resistance wire passes a small current and a low resistance passes a large current.
METHOD:
Fair testing:
In this experiment I will only change 1 factor, which is the length of the wire. The following factors that are going to be kept constant are:
The room temperature – since if the temperature is increased the particles in the wire will move faster and this would not allow the experiment to be fair.
The cross-sectional area of the wire – the thicker the wire, the less resistance. Thus, this would affect the resistance and the experiment would be unfair.
The material of the wire – this, as well, would affect the resistance because different materials have different conductivity, like I said earlier.
The potential difference or voltage – if this is changed, the temperature of the wire would also change therefore making the test unfair.
Equipment:
Nichrome wire, over 50cm long.
A variable DC power pack.
Resistor
Two crocodile clips
A 50cm ruler
0 – 1 volts voltmeter
0 – 1 amps ammeter
connecting wires
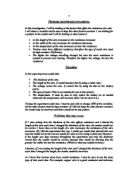
Diagram:
Safety:
Although this experiment is not very dangerous I still need to be cautious. I have to check if there are any breakages in the insulation of the circuit wire, I must keep the current low, handle with dry hands to prevent electrical shocks.
Procedure:
Firstly, I will connect the circuit as shown above.
Adjust the resistor until ammeter reads ___
Record voltage shown on voltmeter
Then, repeat the experiment with the following lengths of wire (cm):
5, 10, 15, 20, 25, 30, 35, 40, 45.
5. After that, I will use ‘Ohms Law’ to calculate the resistance:
Table: This is how my table should look like:
Accuracy and Range of Readings:
To make this experiment as accurate as possible I need to make sure that the length of the wire is measured precisely and make sure the wire is as straight as possible whilst I do this. I need to also ensure that the wire is straight while I do the experiment since this will affect the resistance leaving anomalous results. The readings of the voltage and current should be taken immediately after the circuit is connected because as soon as the current is put through the wire it will get hotter and we only want to test it when heat is affecting the wire the least, at the beginning.
To make my experiment as reliable as possible I will repeat it 3 times and then find an average result using the ‘arithmetic mean’.
Arithmetic Mean = ∑ x
n
Where:
‘∑’ is a capital Greek letter (sigma). ‘∑x’ means the sum of all the terms and ‘n’ is the number of terms.
I will use this formula to calculate my ‘Average Resistance’ and for the ‘mean of graph’ (this allows me to work out the exact point where the line of best fit runs straight through).
Graph – Line of Best Fit:
To calculate the line of best fit we need to use the formula:
Y = mx + c
Where:
‘Y’ is the y-axis, ‘m’ is the gradient (y/x), ‘x’ is the x-axis, and ‘c’ is the y-intercept.
Here are examples of 3 main types of correlation:
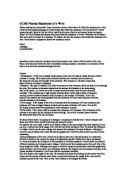
RESULTS: Width of Wire: 0.55mm
*I have rounded my results to 2 decimal places to allow them become as accurate as possible.
GRAPH:
Y = mx + c
Y = mx + 0.13
Y = (y/x) + 0.13
Y = (1.47/40) + 0.13
Y = 0.037x + 0.13
Real life: - for 0.55mm of nichrome wire
Average Resistance (ohms) = 0.037 x Length (cm) + 0.13
Check:
Lets assume that the Length (cm) is 10cm, what would the Average Resistance equal to?
Y = 0.037 x 10 + 0.13
Y = 0.37 + 0.13
Y = 0.5
this proves that my formula was accurate.
MEAN OF GRAPH:
Mean of Length = Total Length = 225 = 25
No. of Readings 9
Mean of Average Resistance = Total Average Resistance = 9.44 = 1.05
No. of Readings 9
Mean of Graph = (Mean Length, Mean Average Resistance)
CONCLUSION:
From my investigation I have found out that the resistance of a wire does change in proportion to its length. This is because as the length of the wire increased, the electrons increased as well, therefore there were more collisions which meant higher resistance. I knew, from the start of this experiment, that my results would lie on a positive correlated trend as I portrayed in my prediction. Because of thorough research, I found all the information that explained the relationship between the resistance and the length; this is why my results agreed with my hypothesis.
EVALUATION:
I believe that my results, in general, were reasonably accurate. However, I knew that if I used a voltmeter and an ammeter which was digitally calculated, instead of an analogue one, I suppose that my results would have been far more accurate than the ones I have. Nevertheless, my results on the graph lied on a straight line with two slight anomalies: (35,1.34) and (40, 1.7).
I believe that this happened since the nichrome wire wasn’t completely straight or it might not have been the same thickness throughout the length and this could have been the reason why the results weren’t consistent as it would have been. The crocodile clips were not always fixed securely to the wire with a good connection. This also meant that they were easy to move about on the wire, changing the length of it.
I also believe that the crocodile clips could have affected the fairness of the experiment because they are a different type of metal compared to nichrome wire which has different properties and consequently different resistance. This means that the resistance of the nichrome wire showed up on both voltmeter and ammeter was slightly more than it actually was. I could have solved this problem by doing the following method:
Firstly find the resistance of the connecting wire and the crocodile clips before each experiment
Then, minus it from the overall resistance of the nichrome wire plus the connecting wires and the crocodile clips.
Here is a formula I came up with to calculate the resistance of nichrome wire:
N = R – C
Where:
N = the resistance of nichrome wire.
R = the overall resistance of nichrome wire, the crocodile clips, and the connecting wires.
C = the overall resistance of crocodile clips and connecting leads.
Overall, I believe that the data provides sufficient evidence to support my theory and conclusions.
I could have improved my investigation to support my analysis by doing other experiments such as the following – I have also added a prediction for each factor from my own scientific knowledge:
The diameter (cross-sectional area) of the wire:
I believe that as the diameter of the wire increased, the resistance would decrease. This is because there are more space for the electrons to travel through, therefore less collisions.
The temperature of the wire:
I think that if the wire is heated up, the atoms in the wire will start to vibrate faster because of their increase in energy. This will cause greater collisions between the electrons and the atoms. So, there would be higher resistance.
The material of the wire:
I think that the type of material of the wire would affect the amount of free electrons. This is because the number of electrons depends on the amount of electrons in the outer shell of the atoms. If the material has a high number of atoms there will be high numbers of electrons causing a lower resistance because of the increase in the number of electrons. Also if the atoms in the material are closely packed then the electrons will have more recurrent collisions and the resistance will increase.