·Pipettes-will be used to measure out the Hydrogen Peroxide into the 10ml measuring cylinder.
·Safety goggles-worn at all times for protection.
Fair Testing
I will make sure this is a fair test by being careful to regulate all the variables that I don’t want to change. One of the ways I did this was using exactly the same amount of catalase (yeast) for each test. I ensured this by using the precise measurements of the top pan balance to measure out 0.25 grams of yeast. I also used the same amount of substrate (hydrogen peroxide) for each test. I measured out this using a small 10ml measuring cylinder and a pipette. I shook the yeast just before the experiment to make sure that it was all balanced out. I also used the same sized test tube, measuring cylinder and delivery tube for each experiment.
Preliminary Work
Already having chosen my substrate (hydrogen peroxide), I then set about choosing a suitable catalase. I narrowed this down to three choices, Potato, liver and yeast. Potato and liver only released a small amount of catalase when reacting with the hydrogen peroxide. Therefore the amount of gas produced would have been so small that it would have been very difficult to accurately measure and compare results, thus making a link between the concentration of substrate and rate, almost impossible. I therefore chose yeast as it releases the largest amount of catalase and would therefore make it easier to measure the amount of gas and be able to make clear observations of the results.
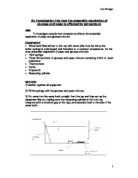
Diagram
Method
- Clear work surface of any un-needed equipment e.g. bags and chairs.
- Put on safety goggles for the remainder of the practical.
- Collect all the equipment listed.
- Measure out yeast using the top pan balance and Hydrogen Peroxide using a pipette.
- Fill the two larger measuring cylinders to the brim with water.
- Fill the water bath about halfway full.
- Place the measuring cylinders upside down in the water bath allowing as little air as possible to get into the measuring cylinder.
- Set up the delivery tube and put one end going into the measuring cylinder and the other to the test tube as shown in diagram. (see above)
- Place all the yeast into the test tube.
- Add the hydrogen peroxide to the yeast and quickly attach the delivery tube to the test tube while simultaneously starting the stopwatch.
- Measure and record the amount of gas in the measuring cylinder every 10 seconds. If the first measuring cylinder is filled, quickly transfer the delivery tube to the next cylinder. Continue measuring until the reaction finishes.
- Clean equipment and repeat for other concentrations.
Safety
Throughout the experiment safety was a key priority and I therefore took many precautions. I made sure that I wore safety goggles at all times, cleared the area of anything that could get in the way (stools, bags etc.) and was extra careful when handling the Hydrogen Peroxide.
Results
Time (seconds)
I then plotted these onto a graph. (Overleaf)
Observations
During the experiment I noticed that it was difficult to read the amount of gas every 10 seconds accurately and very difficult for the higher concentrations to change over the measuring cylinders without letting any gas escape. I also noticed that a lot more gas was produced a lot faster when the higher concentrations of hydrogen peroxide were used.
Analysis
I was able to calculate the rate of reaction for each concentration of hydrogen peroxide, but as the graph was not straight, the rate of reaction (rate of production of gas) varied, it got slower as time passed as there was less substrate to react with the yeast:
I therefore measured the rate at every 10 seconds:
Rate = Amount of gas collected in last 10 seconds / 10
5%
1.) R = 5/10 2.) R= 22/10 3.) R= 11/10
= 0.5cm^3/s = 2.2cm^3/s = 1.1cm^3/s
4.) R = 7/10 5.) R= 1/10 6.) R=0/10
= 0.7cm^3/s = 0.1cm^3/s = 0.0cm^3/s
10%
1.) R = 10/10 2.) R= 30/10 3.) R= 20/10
= 1.0cm^3/s = 3.0 cm^3/s = 2.0cm^3/s
4.) R = 15/10 5.) R= 10/10 6.) R=5/10
= 1.5cm^3/s = 1.0cm^3/s = 0.5cm^3/s
15%
1.) R = 22/10 2.) R= 28/10 3.) R= 37/10
= 2.2 cm^3/s = 2.8cm^3/s = 3.7cm^3/s
4.) R = 18/10 5.) R= 17/10 6.) R=6/10
= 1.8cm^3/s = 1.7cm^3/s = 0.6cm^3/s
20%
1.) R = 40/10 2.) R= 60/10 3.) R= 30/10
= 4.0cm^3/s = 6.0cm^3/s = 3.0cm^3/s
4.) R = 14/10 5.) R= 11/10 6.) R=6/10
= 1.4cm^3/s = 1.1cm^3/s = 0.6cm^3/s
I then plotted these onto a graph. (Overleaf)
The trend is an increased rate of reaction as the hydrogen peroxide concentration increases. It is fastest at the start and then slows down until it stops. This is because as the reaction occurs the hydrogen peroxide continues to be separated by the catalase, the amount of hydrogen peroxide decreases and therefore the reaction slows and eventually stops. The investigation has shown that an enzyme controlled reaction can be affected by substrate concentration.
The results seem to agree well with my prediction as I predicted that the higher the concentration of substrate the quicker the reaction with yeast and the faster the amount of gas given off (rate of reaction), and this has occurred.
Graph Analysis
As the graph shows, it is not linear graph and therefore a steady gradient is not possible.
However, this graph is a direct proportion graph as the time is proportional to the volume of gas produced. In this circumstance, the graph is likely to have the following equation:
(The graph will obviously not be exact because the various results do not correspond exactly to the equation).
Y is proportional to √X Therefore: Y=k√X
Y=amount of gas X=Time k=constant
5%
5.666667=K√10 42=K√40
K=5.666667/√10 = 1.79195 Y=1.79195√X K=42/√40 = 6.6408 Y= 6.6408√X
25.66667=K√20 43.3333=K√50
K=25.666667/√10 = 5.7394 Y=5.7394√X K=43.3333/√50= 6.1282 Y=6.1282√X
37=K√30 43.66667=K√60
K=37/√30 = 6.7552 Y=6.7552√X K=43.66667/√60= 5.6373 Y=5.6373√X
10%
10=K√10 81.66667 =K√40
K=10/√10 = 3.1622 Y=3.1622√X K=81.66667/√40 = 6.6408 Y= 6.6408√X
40.66667=K√20 88.66667=K√50
K=40.66667/√20 = 5.7394 Y=5.7394√X K=88.66667/√50= 6.1282 Y=6.1282√X
62.33333=K√30 92 =K√60
K=62.33333/√30 = 6.7552 Y=6.7552√X K= 92/√60= 5.6373 Y=5.6373√X
15%
23.3333=K√10 105= K√40
K=23.3333/√10 = 7.3786 Y=7.3786√K K= 105/√40 = 16.6019 Y=16.6019√K
57.66667=K√20 121.3333=K√50
K=57.66667/√20 = 12.8946 Y=12.8946√K K=121.3333/√50 = 17.1591 Y=17.1591√K
88=K√30 131=K√60
K= 88/√30 = 16.0665 Y=16.0665√K K=131/√60 = 16.9120 Y=16.9120√K
20%
38.33333=K√10 153=K√40
K=38.33333/√10 = 12.1220 Y=12.1220√K K=153/√40=24.1914 Y=24.1914√K
95=K√20 165=K√50
K=95/√20 = 21.2426 Y=21.2426√K K=165/√50=23.3345 Y=23.3345√K
126.6667=K√30 169.6667=K√60
K=126.6667/√30 = 23.1260 Y=23.1260√K K=169.6667/√60=21.9038 Y=21.9038
Conclusion
From this investigation I wanted to find out how the speed of reaction with a catalase (yeast) can be affected by the concentration of substrate. (I used Hydrogen Peroxide) Though not being perfectly accurate, this investigation showed that the higher the concentration of substrate, the quicker the rate of reaction and the greater the total amount of gas produced. This agrees with my prediction. It also makes sense as it seems correct that the higher the concentration of substrate i.e.; the more substrate there is to react with, and so the reaction would be quicker.
Evaluation
I think my investigation was a success as I found a good link between the concentration of substrate and the rate and volume of reaction. I was able to write a conclusion, though in my conclusion I could not describe exactly how much the rate of reaction increases for per percentage of concentration increase. This was due to my results not being accurate enough to make the calculations secure. The other thing that made this difficult was that we instead of measuring for a set amount of time say 2 minutes; we just measured the amount produced until it stopped. This meant that I could not reliably work out averages after a certain point. That is not to say that my investigation was perfect, far from it. Throughout the experiment there were many things that are likely to have caused inaccuracies in my results. The thing most likely to have had the biggest effect on my results was the lack of large measuring cylinders. Because of this on the higher concentrations when the first cylinder was filled with gas, I had to change to another cylinder. Though this was done as quickly as possible, a large amount of gas will still have been lost through doing this. Another inaccuracy was trying to read the measurements of the measuring cylinders as it was difficult to see properly. To solve this I could have used a syringe to collect the gas instead of a measuring cylinder. This would have made it easier to read the results and so it would have been read out exactly every ten seconds. Solving these problems would have given me far more accurate results, and therefore, a more accurate conclusion.