In a reaction where the reactants (Sodium Thiosulphate) are in a high concentrations the particles are crowded close together and will collide with each other more often, resulting in an increased number of successful collisions which makes the rate of reaction faster, the reaction will produces a white precipitate of sulphur. This will show the higher the concentration the increase in how fast the solutions react to become sulphur dioxide (g).
Method
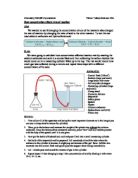
For Safety precautions I will used eye protection (goggles) in case something goes wrong. If anybody encounters the experiment, who has asthma they must let the teacher know. As the gas produced, sulphur dioxide, may trigger an attack. To go through this experiment this is how to do it:
- Mark an “X” onto a piece of paper and place it underneath the 100cm3 conical flask.
-
Pour 50cm3 of Sodium Thiosulphate solutions into the flask.
-
Then add 5cm3 of dilute hydrochloric into the flask and start the stop watch immediately.
- Swirl the flask gently, to mix Sodium Thiosulphate and hydrochloric acid.
- Then look downwards from above the flask, when the solution becomes so cloudy, that the “X” cannot be seen, stop the stopwatch immediately.
- Record the time, and wash the flask carefully using distilled water.
-
Repeat the experiment, but using distilled water and using a fixed amount of 5cm3 of dilute hydrochloric acid, again note the time taken for the “X” to disappear. I did this by doing this experiment four more times. I use the following amount of solutions:
-
40cm3 of Sodium Thiosulphate, 10cm3 of distilled water and 5cm3 of hydrochloric acid.
-
30cm3 of Sodium Thiosulphate, 20cm3 of distilled water and 5cm3 of hydrochloric acid.
-
20cm3 of Sodium Thiosulphate, 30cm3 of distilled water and 5cm3 of hydrochloric acid.
-
10cm3 of Sodium Thiosulphate, 40cm3 of distilled water and 5cm3 of Hydrochloric acid.
- I then repeat the whole experiment, so that my investigation will be accurate.
Diagram
I will measure the solutions and then the time for the reaction to be complete. I will observe by looking with the human eye to see the “X” disappear and then I will record the time on the results table. I would use a measuring cylinder to measure the solutions to make my results more precise and reliable. I feel that I cannot make the experiment any more reliable as its all down to the human eye to see the “X” be invisible so it could be all down to human error.
Fair test
In order for my findings to be valid the experiment must be a fair one. I will use the same standards each time for judging when the “X” has disappeared. I will make sure that the measuring cylinders for the Hydrochloric acid and Sodium Thiosulphate will not be mixed up. The amount of Hydrochloric acid will be 5cm3 each time. All these precautions will make my final result more reliable and keep anomalies at a minimum so thus make the entire investigation more successful.
I will control the amount of solutions are put into the flask. I will not be able to control how fast the reaction takes. I will make the investigation more reliable by repeating the whole experiment; the results will backup the first results and be more reliable. I will create a line graph of both results. I have chosen to go down in tens then it will show me a average on how fast the rate of reaction is. For accurate measurements I will use a measuring cylinder which is rounded to the nearest mm. Seeing the factors of rate of reaction is concentration I decided to record the time on how long the reaction needs to become finished. The trial results have helped me to finalise my plan, as the results have helped me to finalise my plan, as the reaction times decrease and the concentration increases.
Results of experiment
1st set of results
2nd set of results
Average of both results
1st of results
2nd results
Average of both results
Conclusion
My results backup my prediction that as the amount of solution increases, the rate of reaction decreases. I will show my results on a line graph, it will show a curve with negative correlation. I feel that this is the best way the represent the results as you can see the pattern as the line decreases. On the X axis is the amount of solution and on the Y axis is the time. The results were very good as the time increased when the solution decreased. There is a pattern in my results, that the times of the reaction increased all the time I added more Sodium Thiosulphate, and less water. I found that the Sodium Thiosulphate, HCl and volume of water produced a creamy white precipitate of sulphur while sulphur dioxide and water. I didn’t put the results in a different order because I started with 50cm3 of Sodium Thiosulphate then decrease by tens, so there weren’t any problems. The line on my graph is a negative curve as the concentration decreases the time increases so it will be a curve. I will not have to produce a line of best fit. There is a pattern in my graph, as the solution decreases the times increase as the graph shows, for example 50cm3 of Sodium Thiosulphate has a time of 11.84s compared to a concentration of only 20cm3 the time is 39.70s. There is definite relationship as the point are on the curve is there wasn’t a relationship the points will have no correlation they will be everywhere. The relationship is it decreases all the time. As I added more concentration there is more of a successful result of collisions as particles are close together, this produced a faster rate of reaction this is shown in my result, this also proves my prediction. My conclusion compares with my prediction as my result prove it has the amount of solution decreases the time increases. The results support my predictions, so it’s right.
Evaluation
The method that I used was very good as I obtained evidence to prove my prediction. The experiment was easy and fast to complete. As I done the experiment twice it made the quality of the results better as both sets of results were closely together. I think this gives me more of a accurate reading. I expected my graph to be a curve and my graph shows a bit of a curve as the solution increases. My results shows no anomalous results, as the graph also shows. I think the second reading helps me determine there was no rogue results that do not fit the pattern as the results were very close together. I feel that the evidence was valid as I repeated the experiment twice and the times were the same, I used a measuring cylinder to measure the solution so it would be a fair test, the only thing which affects it becoming a fair test is human error as it is difficult to get accurate readings due to inevitabilities of human errors. The results support my conclusion. I think I collected enough evidence to support my conclusion as 2 sets of results will be enough to see the rate of reaction of Sodium Thiosulphate. My difficulties I had as I carried out the experiment was to see when the reaction was compare as the “X was still visible but hard to see with the human eye.
If I repeated the investigation I would make changes to my method. There is five factors which affects the rate of reaction, according to the collision theory of reacting particles: temperature, concentration (of solution), pressure (gases), surface area (of solid reactants), and catalysts. I chose concentration because it was the most practical to investigate and there is only one more of the five factors that I could include in this experiment, I used concentration of solution. I couldn’t use solid or gas as solids will take a lot of time to prepare and gas is mostly colourless it is difficult to gauge a reaction changing the pressure , and if a substance is added to give the gas colour, it may influence the outcome of the experiment. So I could have done the temperature, as particles move slowly when cold and when heated the reaction mixture the particles will move quickly and collide with each other more often, with a greater energy, and many more collisions will be successful. By including temperature I would be investigating another factor which affects rate of reaction of Sodium Thiosulphate. I would write down the temperature and a fixed amount of all solutions and the temperature decreasing all the time in tens. I would then record the times. By keeping the solutions the same I would see how much affect temperature has on the rate of reaction. The extra evidence would make me certain of my conclusion, as I believe as the temperature increases the time decreases due to the particles moving faster and causing more collisions. This experiment was good enough to show that concentration affects the rate of reaction of Sodium Thiosulphate.