Prediction
My prediction is that as the size of the huddle gets larger, heat will be retained for longer, and the temperature will take longer to decrease as well. I think this because of the reasons, which I listed in my background information, which were that the exposed area of a group of animals is less for each animal then for an isolated animal. The total surface area exposed when ungrouped is much higher then total surface area exposed when grouped. This greater surface area means the heat has a greater surface area to transfer from. The transfer of heat is usually from animals is usually via conduction and convection. Conduction is heat transfer through means of molecular agitation within a material without any motion of the material as a whole. Convection is heat transfer via mass motion when the heat is caused to move away from its source.
When conduction occurs, the high-speed particles, which are the heated ones, will collide with the slower particles, the cooler ones, and the energy will be transferred from the faster particles to the slower ones. The rate of conduction can be worked out using the following formula:
When convection occurs, the hot air expands, thus becoming less dense, and therefore rising, carrying less energy with it, this causes convection currents, which transport energy,
Method
For this experiment, I will be controlling the size of the huddle, as I want to see how the size of the huddling group affects the survival of warm blooded animals in the arctic. To conduct this test I will have to simulate arctic conditions, and to do that I will need the following equipment:
- Large 2-litre water beaker
- Ice
- Water (cold and hot)
- Test tubes
- A ruler
- Stopwatch
- Rubber bands
- Thermometer
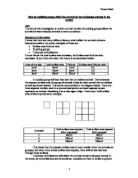
Using the large 2-litre water beaker, I will fill it with a 2.5 inch depth of ice. I find it hard to be more accurate then that, as each piece of ice varies greatly in size, I will make sure that I get as close to the 2.5 inch depth as possible. I will then fill the beaker with cold water, up to the 1 litre mark. I will then allow the water to cool down for one minute, and then take the temperature, and note it. I will then fill the test tubes up with 80ml of hot water, and record the temperature. I will then place the test tubes in the centre of the large beaker and start the stopwatch. The test tubes will be bound together using rubber bands. I will conduct the experiment using 4, 6, 8, 10, and 12 test tubes. I will check the temperature every minute, and record it. I will do this for 10 minutes. With these results, I will be able to plot them onto a graph, and I should be able to work out a gradient. The steeper (higher) the gradient, the quicker the rate of heat loss. All measurements will be taken as accurately as possible; temperature due to the limitations of the thermometer will be taken to the nearest whole number. If I feel that I obtain any measurements, which are wrong, I will continue the experiment and afterwards decide on the effect this has. If this has a dramatic effect, I will repeat the whole test for that specific huddle size.
I will have to take safety precautions with the water as it will be very hot, I should also take care handling the test tubes as the glass may break when it becomes hot, then is exposed to the ice cold water
Diagram
Results
I have plotted the results of the experiment onto graph paper included with this investigation.
Conclusion
I have plotted the results on to a graph, and from this, I can see that as I increase the size of the huddle, the heat is retained for longer, and overall, the temperature takes longer to decrease. These findings agree with my prediction. I can spot two trends in my graph. The first is that during the first minute, the temperature drops considerably, as shown by the steep lines in that sector of the graph. After that, the gradient of the lines becomes shallower, and the temperatures begin to drop at a much slower rate. To prove this I will work out the gradients of each of the lines. The higher the gradient, the quicker the rate of heat loss. To work out the gradients I will use the following formula:
These results also show prove my theory that as the huddles become larger, the temperature takes longer to decrease. This is because when the animals are grouped their total exposed surface area decreases significantly when compared to exposed area ungrouped. This reduced exposed surface area means there is less exposed surface area for heat to be lost via conduction and convection.
Evaluation
In my opinion, this experiment has worked fully. I believe there were no faults in my plan or method, however during the experiment, there were improvements, which could have been made, but were too late to implement, and I have discussed these further in the evaluation. I believe that the results give a reliable, accurate, and valid conclusion. They agree with my hypothesis, and the theories such as conduction and convection, which I explained in greater deal in the background information section of this investigation. To make this experiment a fair test, I had to control certain things. These were:
- Depth of ice
- Amount of water
- Temperature of cold and hot water
To control these things, I will make sure that all the quantities are the same, and where required, the temperatures. The only thing I varied was the size of the huddles. In addition, when recording the temperatures I made sure I took the reading from the test tube in the middle of the huddle. Luckily, I obtained no anomalies, or “odd” results. In the future, if I was to conduct improve the experiment again, I think there are certain changes, which I could make. One of these changes would be using a stand, boss, and clamp to place the test tubes into the ice-cold water, because whilst conducting the experiment, I found sometimes the huddles of test tubes would move position, because they were not fixed in place. A boss, clamp, and stand would resolve this issue.