Add about 3 pipettes of sodium hydrogen carbonate solution to each boiling tube. This is to provide carbon dioxide to the plant as it is vital in photosynthesis. With scissors, cut the end of each piece of pondweed diagonally while it is still under the water. It is important that you do this while submerged in water because you are removing any air locks in the xylem tubes of the plant, which would prevent oxygen bubbles from escaping. This would lead to anomalous results.
Half-fill a glass beaker with water, and leave the boiling tubes containing the pondweed there for approximately one minute. Check them to see which is producing bubbles the most rapidly. This is the one you will use for both the experiments.
You must do the light intensity investigation first, because we do not want the pondweed to be damaged after being in high temperatures. This is also why you will do the lower temperatures first in the temperature investigation.
For the light intensity investigation…
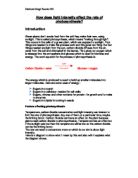
Set up the apparatus as shown in the diagram on the following page.
Make sure the black paper is attached to the beaker so that only the front of it is exposed to the light. This is to ensure that the plant takes in only the light from its own lamp. This is why you must also make sure all the main lights in the room are turned off.
Put the water bath with the boiling tube with the best piece of pondweed in on the test tube rack. This is just so it is as close to the level of the light as possible. Put the lamp 10cm away from the water bath. Allow 2 minutes adjustment time for the pondweed so it can get used to its new environment. Otherwise the plant will not produce oxygen at a steady rate. Then, start the stopwatch, and begin counting bubbles. After one minute, stop the stopwatch and note down how many bubbles were counted. Repeat this paragraph 3 times.
Place the lamp 20cm away from the water bath. Leave the pondweed for 2 minutes, as adjustment time for it to get used to its new environment. Otherwise the plant will not produce oxygen at a steady rate. Then, start the stopwatch and begin counting bubbles. After one minute, stop the stopwatch and note down how many bubbles were counted. Repeat this paragraph three times.
Repeat the previous paragraph except for 30, 40 and 50 cm away from the water bath. This should give reliable results, because of repeated readings and the range of 10-50cm in intervals of 10cm.
If the pondweed stops bubbling at any time during the experiment, this may be due to an air lock in the xylem tubes of the plant. In this case you need to cut the end of the pondweed with no leaves on while it is still under the water. This should stop the air from blocking up the xylem tubes of the plant. The other problem may be that the plant has used up all the carbon dioxide form the sodium hydrogen carbonate solution. In this case you need to add two or three 1ml pipettes of the solution to the water the pondweed is in.
Variables
the dependant variable is light intensity
the indedendent variable is the rate of photosynthesis
1) the power of the light bulb
2) the piece of pondweed
3) adjustment time
4) temperature
Conclusion
I conclude that the greater the light intensity, the quicker the rate of reaction. For photosynthesis, plants require light and chlorophyll to make the reaction happen. They are not constituents of glucose but are still vital. So, when the lamp was further away from the pondweed the plant was unable to photosynthesis as well as when the lamp was right up close to the pondweed. When the lamp was 50cm away, an average of just 3 bubbles was produced, compared to an average of 25 for 10cm away. As the lamp was moved further away, the light intensity increased, therefore the rate of photosynthesis increased. The pondweed had more light energy for photosynthesis and was therefore able to produce more oxygen bubbles in one minute.
Looking at the light intensity graph, you can see a trend. It shows that the rate of photosynthesis and light intensity are proportional to each other. This is because there is a straight line of best fit going down as the distance increases (when the distance is increasing this is the equivalent of the light intensity decreasing).
In my prediction I said that for double the distance there would be half the amount of bubbles, but this did not happen between 10cm and 20cm. 10cm away from the lamp the pondweed produced an average of 25 oxygen bubbles. At 20cm the plant produced 20, and this is not even close to half of 25. However, 40cm away from the lamp, an average of 8 bubbles was produced by the pondweed, which is a little under half of the 20 bubbles at 20cm. So there was some truth in that prediction. Perhaps my results were slightly anomalous.
I also conclude that temperature affects the rate of photosynthesis in that there is a peak around 40-50°C. At the lower temperatures the plant was unable to produce many bubbles, if at all. Unfortunately due to time restrictions we were unable to go up to 100°C, but I have made an estimate of what would have happened on the temperature graph. It would have decreased until eventually the pondweed was not producing any bubbles at all.
Chlorophyll is used to make photosynthesis happen in plants. It is an enzyme, and all enzymes need some heat to activate them. This is why at the lower temperatures the rate of photosynthesis was so low. As the temperature increased, so did the rate of photosynthesis. At around 40-50°C was a peak. This was when the rate of photosynthesis was the highest. After that, it decreased. You might expect the trend to be that the higher the temperature, the higher the rate of photosynthesis, but this is not the case. Enzymes work rather like a lock and key. They are specifically designed for one purpose – in the case of chlorophyll it is to activate photosynthesis. If a key is heated up, it will melt and become denatured and can never be restored to its original shape. This is how enzymes work. When the temperature is over 50°C, the enzymes are damaged and no longer fit the “lock” they were designed for. This is what causes the peak.
On the graph you can see this trend of a peak (although the second half of the graph is an estimate). It is a lot clearer than looking at the results table. It supports my prediction, unlike for the light intensity investigation, although they do not support what I said about the peak, as I have only been able to estimate.
Evaluation
I think that the procedure used was quite suitable, as we managed to achieve fairly reliable results. However, when dealing with living things the results can never be that accurate, because living things do not work at a constant rate. So we cannot know if the plant was working at a high or a low rate or somewhere in between when we did the experiment. I think it might have been working at a low rate judging by the fact that the most bubbles produced in the whole experiment was 25. This is nowhere near as high as I expected. However, at least the results were not completely anomalous and I was able to draw reasonable conclusions from them.
There is not really any way in which we could improve this procedure, because living things are so unreliable. However, we could take results over a period of several weeks for more accuracy. This way we would catch the pondweed at times when it was working at a high level and at times when it was working at a low level.
Another thing that was not very suitable was the way of measuring the rate of reaction. Counting the bubbles got very boring and I could easily have miscounted, leading to anomalous results. A better way would be to find some way of collecting the oxygen bubbles in a capillary tube and measuring how far along the oxygen goes. We would have to fill the capillary tube with water and seal the top, and attach the tube to the pondweed. Although fiddly this would be more reliable.
There were no anomalous results, but if there were there are many reasons why it could be. For a start, I could have miscounted the bubbles. Also, the pondweed might not have been bubbling properly due to an air lock that I did not notice. Similarly, there might not have been enough sodium hydrogen carbonate solution, which provides carbon dioxide for the plant. Also, there is the possibility that the piece of pondweed used was damaged – for example perhaps it had been heated up too much and the chlorophyll had become denatured. Because there were no anomalies, this supports my prediction in that they were reliable.