Equipment
1)Lamp 2)Ruler 3)Canadian Pondweed 4)Test tube 5)Straw 6)Water 7)Glass Beaker 8)Glass Funnel 9)Thermometer 10)Timer 11)scissors 12)Hydrogencarbonate Indicator
Variables
Out of the 5 variables that need to be kept the same there are two of them that would affect the experiment a great deal they are the temperature of the water and the CO2 concentration. The temperature of the water is so vital because many reactions in photosynthesis are controlled by enzymes and therefore temperature sensitive. For temperate plants, the optimum temperature for photosynthesis is 25 c. The CO2 concentration is also vital because the usual concentration of carbon dioxide in the atmosphere is 0.03%-0.04% and increasing the concentration of carbon dioxide will dramatically increase the photosynthetic rate.
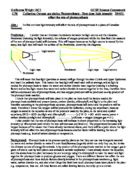
I will keep the length of pondweed the same by measuring it with a ruler every time so it will stay the same length, which is 10cm. I will keep the volume of water the same by measuring the amount of water out in a measuring cylinder. I will keep the temperature of the water the same by checking the temperature of the water with a thermometer every 5-10 seconds and if I need to I will add cold water because the water might become warmer by the waste energy from the lamp. I will keep the CO2 concentration the same by blowing threw a straw for 5 seconds or until the water goes a yellow colour. I will keep the light duration the same by timing it for 5 minutes each time and turning the lamp off when it gets to 5 minutes. I will change the light intensity by moving the lamp back 10cm every time I carry out the experiment, e.g. first time I do the experiment the lamp will be 10cm away from the apparatus, the next time it will be 20cm away apparatus an so on.
Prediction
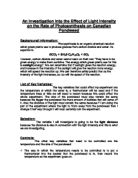
I predict that the closer the lamp is to pondweed the faster photosynthesis will take place because light is needed for the reaction and there will be more input energy. The rate of photosynthesis to the light intensity is inversely proportional so it will increase rapidly at first but will not increases so rapidly when the lamp gets closer to the pondweed. When the lamp gets close to the pondweed the lamp will be giving all the light (energy) that the pondweed will need to photosynthesise at its optimum speed. It cannot photosynthesise any faster because there is only a certain number of chloroplasts containing a limiting amount of chlorophyll and this can only absorb a certain amount of light which is called the light saturation point but if the light intensity is to high then it could bleach the chlorophyll and delay photosynthesis. The other limiting factors should be at their optimum or remain constant throughout the experiment and so should not affect the experiment. So overall I think that the most oxygen bubbles given off will be when the lamp is 10cm away from the pondweed because it is not to close and therefore wont bleach the chlorophyll and delay the rate of photosynthesis, I think it is the ideal distance. When the lamp is 20cm and 30cm away from the pondweed they will be relatively similar results and a difference of approximately 20 air bubbles. It will give off the least oxygen bubbles when the lamp is 40cm away from the pondweed because the further the lamp gets away from the pondweed the harder it is for the chlorophyll to absorb the light so it will take longer to photosynthesise.
Results
I worked out an average for each distance on my results so it made them much more reliable, my averages are in the table below.
Analysing
As you can see from my table, my results are very varied because in my prediction I said that the closer the light to the pondweed the more oxygen bubbles would be given off but in my results it goes against my prediction. As 20cm away gave off the most oxygen bubbles, 40cm away gave off second highest amount of air bubbles followed by 10cm away and then 30cm and in last place as I predicted it was 50cm, the only result that went with my prediction was 50cm away from the pondweed. In my experiment there wasn’t actually any trends or patterns, the results were not the same as I predicted and there is no clear pattern or trend that has occurred to me. As you can see above I have made an extra table for making an average for each distance, I did this so it would make my test more reliable and accurate and therefore place them in an order for me to see which gave off the most oxygen bubbles and so on. The scientific knowledge that I knew before this experiment was that plants need light to carry out photosynthesis and produce bubbles of oxygen gas, but if light is limiting, then the rate of photosynthesis is also limiting which allows the rate of bubbles to slow down and the less oxygen bubbles is produced but unfortunately my results did not show this as I had first expected. Maybe my results were so varied because we did not have the exactly the same amount of carbon dioxide in each test but this would be down to not having top range equipment to make sure the amount of carbon dioxide stays exactly the same.
Evaluation
The accuracy of my measurements and observations were mostly reliable and
accurate there, were a few results that were off the graph and anomalous which showed that not most of my results were accurate but were clear. Anomalous could have occurred because a factor was limiting or a fair test may have not been performed efficiently. I made accurate measurements when I was measuring the distance between the lamp and pondweed and also measured the time extremely accurately. I measured the amount of bubbles which were produced in 5 minutes accurately and mostly dependable. If I had missed any it proved that I had not performed a fair test. I measured the amount of carbon dioxide that I used as accurately as I could to keep it the same amount for each test. Anomalous results occurred throughout all of my tries apart from distances 30cm and 50cm away. I think it happened the most from 10cm, 20cm and 40cm away because most of the factors that affect photosynthesis were limiting and then it produced anomalous results whilst doing my experiment. My line of best fit did not suit some of my results because I had anomalous results as a result of this. I may have had anomalous results because some of the factors were limiting by the time. Something or a factor was limiting. I would suggest that it was the temperature because it could have got too low and slowed the rate of photosynthesis or maybe the concentration of the carbon dioxide would explain the amount of anomalous results. The evidence is just about sufficient enough to support a firm conclusion because about half of the results are nearly accurate, although some are anomalous when drawing a line of best fit. Some results that were plotted are in one place and some scatter off on the graph which prove that they are anomalous and something was not accurate during the experiment such as a factor that was limiting. Evidence is sufficient as a clear pattern is discovered that this is because the rate of photosynthesis slows down and ultimately this supports this firm conclusion. The improvements I would make for further work is to allow my results to be even more accurate and fair and much more reliable, but trying to avoid anomalous results when obtaining evidence and analysing evidence. I would like to provide additional evidence for the conclusion by extending the results and making more justifications and using scientific knowledge for more key factors that could be tested which I would like to investigate and test on with this similar method.