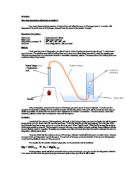
Using a stopwatch, I measured the amount of hydrogen gas produced at 15 second intervals. To make sure the experiment was carried out fairly, the only variable changed was the temperature of the acid. All the containers used were as similar as possible, and fresh acid was used for each experiment, to maintain concentration. The same bunson, water bath, measuring cylinder, rubber tube and stopwatch were used throughout.
Prediction:
I predict that the outcome of this experiment will result in the Hydrogen being produced at a faster rate with increased temperatures, and at a slower rate with lower temperatures. I think this because at lower temperatures, the molecules within the chemicals have less energy, and so do no move about as much. When I heat the acid, I think that the energy this provides will increase particle movement. This increased movement will mean more collision between particles: these collisions will also be more likely to result in a reaction. If particles are reacting more often with each other then the reaction between the acid and Magnesium will take place faster.
However I think that the maximum amount of Hydrogen collected overall will be the same no matter what – because amounts of acid and Magnesium remain the same. The amount of Hydrogen produced is limited to the amount of Magnesium or acid that is available to react, and thus produce it.
The equation for the reaction between Magnesium and Hydrochloric Acid is as follows
Mg + 2HCl (aq) ➔ H2 + MgCl2 (aq)
The Magnesium reacts with the Hydrochloric Acid to produce Hydrogen, as a gas, and the salt Magnesium Chloride in the water. We know that the gas is Hydrogen because it gives a sharp pop when lit with a splint.
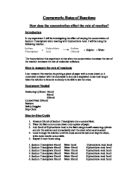
Results:
I performed the experiment three times to ensure accuracy. The results are tabled on the next page, including an average of the three.
Conclusion:
In conclusion, it seems that my prediction was correct. The graphs all show pretty much the same thing with the odd anomaly, however the average off the results looks very supportive of my theory: gas volume being produced faster as the temperature increases. We can also see how the reaction begins very rapidly, and then slows down and finally stops, as the curve inclines steeply at first and then levels out.
Evaluation:
The experiment was on the whole a success. However a lot of the data could have been more accurate: on the first results graph especially there was a lot of rogue data causing some of the curves to overlap. To improve the experiment I could have been more thorough in making sure there was no air in the gas cylinder, and that no Hydrogen escaped when the reaction first started. This was probably what caused only 48 ml of Hydrogen to be produced for one of the experiments (Results II at 300).
I could also improved the way in which the Hydrogen gas was measured, possibly by doing it electronically. Human error in measuring off the amount of gas was probably what caused some of my results (mainly in the Results I, some in Results II) to be slightly nonconforming. Also, if I had taken measurements more frequently, say every 5 seconds, my graphs would be much more representative.