A change in pH can also affect enzyme activity. Each enzyme has an optimal pH range that helps continue its normal formation in an environment, which it operates. A change in pH can alter the ionisation of these side chains and disrupt the normal formation and in some cases denature the enzyme. A denatured protein cannot combine (using lock and key mechanism) with a substrate.
Method
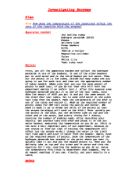
Apparatus-
- Water troth
- Beaker
- Thermometer
- Delivery tube
- Boiling tube
- Measuring cylinder
- Knife
- Tile
- Potato cutter
- Clamp stand
- 2cm of catalase (potato)
- 20 cm3 of hydrogen peroxide
- Timer
- Cork borer
- Burette
- Scalpel
Diagram
Preliminary work:
For my preliminary work I wanted to see how many small (1cm) pieces of potato would be a good number to use for the actual experiment. I will use the same experiment but instead of changing the temperature I will change the number of potato pieces, to see how many pieces of potato worked the best with the experiment that I am using. We chose to use 2 cm of potato because it gave off the most gas in a suitable amount of time.
I will set up the experiment as shown above. Firstly I will fill the water trough with water, and then fill the measuring cylinder with water and place it upside down in the trough with the stand placing it up right. I will make sure that the water was at a specific mark so I can read it off right. I will fill another measuring cylinder with 20cm3 of hydrogen peroxide and cut 2cm of the potato. I will then put water from the kettle into the beaker and add tap water so that it reaches the temperature I want it to be at, I will measure the temperature with a thermometer, once it is at the right temperature I will put the hydrogen peroxide into the test tube and place it into the water beaker adding the catalase (potatoes) and quickly put the bung of the delivery tube into the test tube. At the same time my classmate will add the catalase, the stop clock will start and I will note down how much time it takes to give off 2cm of oxygen. I will do this 5 times using 5 different temperatures starting with 20 c going up to 60 c. the temperature will be the only variable. I am using this range of temperatures because I think it will improve the accuracy of my results.
I will make it a fair test by keeping the hydrogen peroxide and catalase variables constant. I will use 2 cm of catalase (potato) each time. I have controlled the surface area of the reaction by that I have cut them using a borer then sliced into 1cm each. I will be using 20 cm3 of peroxide each time, and will be collecting 2 cm of oxygen each time and noting down the time it took to collect this much amount. I will control the temperature by using a thermometer each time and adding either hot or cold water in 2 changes it.
I will have to be careful whilst using the Hydrogen Peroxide, as it is a corrosive chemical, therefore I will be wearing safety glasses at all times .Bags or any objects in the way will be removed to ensure there are no spillages. Any other items will be moved out of the way e.g. stools under the table.
I will do the experiment 3 times to make the results more reliable and I will also be able to get an average and record my results in a table like this:
Prediction
Using my scientific knowledge I predict that as I raise the temperature to 30-40 this is where I will see the greatest reaction as enzymes are designed to react the best at the body temperature of animals they belong to. For a mammal this is around 35-37 c. as the temperature gets higher the rate of reaction will start to decrease because the enzyme is becoming denatured. The structure of the enzyme is changing and the active site will become destroyed as the temperature increases, then the substrate (hydrogen peroxide) will no longer be able to fit into the active site and the reaction will then stop (lock & key mechanism). This is shown in the graph below. The rate initially goes up as the temperature increases this is because the temperature changes the rate, as the temperature rises, the movement of enzyme molecules and substrate molecules increases. This causes more collisions between enzyme and substrate, and the result is the formation of more product, as the rate of reaction increases. Then the temperature rises beyond a certain point and the enzyme activity declines gradually because the heat, which destroys the active site so the lock and key mechanism cannot take place, as it denatures the enzyme. Also, if I apply twice as much heat there will be twice as much particle vibration therefore the reaction will happen twice as quickly. This is the kinetic theory.
In the graph above we can see that the enzyme activity has increased quite quickly and as It reaches the optimum temperature which is 37 around this temperature the activity starts to fall as the enzyme has reached the temperature where it works best and now it is starting to become denatured as the temperature starts to cook the active site which is the lock to the lock & key mechanism, there for no more product can be produced so the activity will start to fall, which is shown in the graph.
Results
I worked out the rate of reaction by dividing the average time by 1, but because the answer that I got was not suitable enough to be plotted on to a graph I multiplied it by 1000 to get a reasonable answer.
Analysis
My results and graph, I can see when the enzyme was most active and when it started to denature. From the graph, I have found that, as the temperature increases, so does the rate of reaction. I found that the optimum for a catalase Is at 40 . This is where the greatest number of collisions takes place between the enzyme and the substrate and therefore the highest rate of reaction. The rate was higher at the higher temperatures (up to 40 ) because as the temperature is raised, so is the energy level of the enzymes and substrate molecules. This means that they have more kinetic energy so they collide more often and therefore more reactions take place between them. This, is turn, means that the rate increases as more oxygen (O2) is produced. As the temperature raised by every 10 there are more collisions taking place, which caused more reactions and product is made.
We can see that the catalase worked by joining the two substances together to make the reaction work fasted. As the temperature increased beyond the body temperature the active site started to become denatured, because of this the lock * key mechanism could not take place and the rate of reaction started decreasing. The increase in molecular collisions and vibrations at higher temperatures is great enough to permanently change the shape of the active site. The enzyme is said to be denatured because it can no longer form a enzyme-substrate complex (lock & key mechanism) as its active site has been unalterably changed.
The results that I came out with, and put onto a graph show the enzyme activity as there is a curve which goes up steeply, this shows that the rate of reaction increased quickly then it started to fall which shows the denature of the active site, so more product can be made, so therefore there is a drop in the curve.
Evaluation
Although I conducted the experiment as best I could there were many sources of error in the method that I used. Firstly, I could not use the same potato through out the experiment, as it was conducted through out a number of days. This is an error as because the concentration of the catalase in the potatoes may have been different which may have produced an inconsistent rate of reaction. This might be why the values I obtained for the 20-60 do not quite fit the pattern of the graph I expected. To correct this problem I could repeat the experiment not only with the three readings at each temperature, but also with three different potatoes, which could provide an even more accurate reading, as I could calculate an average as I have done with my times. Also if I repeated the experiment I would take more readings for example at every 5 because if I did this I would be able to plot a more accurate graph and it would be easier and more accurate to tell when the enzyme got to the optimum and denaturing temperatures.
Keeping the temperature constant throughout the experiment was hard to maintain, as the temperature of the contents of the tube would change quite quickly, and therefore the hydrogen peroxide wouldn’t be the temperature required. Also it was hard to get it at the right temperature as we used a kettle and had to add cold water or even in some case ice-cubes to get the right temperature. to overcome this problem I could keep the test tubes in a hot water bath for all the temperatures making sure that the water bath was a the suitable depth. This would ensure constant temperature throughout the whole 5 minutes. Also another problem was the measurement of the gas given off, as the burette would keep moving. To overcome this problem I could attach a ruler with a pointer on to the burette or something similar. Using a burette was a good point as it gave a accurate reading of the gas given off in mm. Also I did not count the bubbles of gas that were given off after the timer has stopped as I thought they would not have counted. If I did repeat the experiment I would count these bubbles in as they were made during that time.
Looking back at my results I found some anomalous results in my findings. When averaging I used these results, which could of made the average either lower or higher than it should be. To improve this I should of missed these results and used to ones which would have best fitted into with the other results.
The anomalous results which I found could have been caused by many things such as the losing of gas during the experiment e.g. the bung might not have been tight enough which could of let some of the gas given off into the temperature rather than into the burette. Also as I said before the temperature wasn’t as accurate as I could have been this could have caused there to be anomalous results. If I look at my graph I can see two main anomalous results, which are at 50 and 60, they were firstly too close together showing that the gas given off was mostly the same amount, this may be due to that temperature was not correct or gas was given off into the atmosphere.
Though my results are in line with those that I predicted. The graph indicates the rise in temperature up to a point leads to an increase in oxygen production. This is in lint with the kinetic theory. However it is very clear that after a certain temperature is reached the enzyme actually stops and starts to decrease this supports my theory of lock & key fit.
Overall, due to reliable repeats and in general predictions being confirmed I feel my results are reliable.
Further experiments that I could do, would be to change the catalase used. Also, I would have done the experiment with a piece of liver too, just to make sure that the catalyse activity is the same in the liver as the potato. Although, I already know from what I have been taught, that the liver would give similar results to the potato.