This experiment will require me to take critical care in my treatment of the apparatus in order to achieve not only a fair result but also a correct outcome. This can guarantee me an accurate table of results. The first step to be completed is the cutting of a potato, this is to be done with a cork borer. The samples should then be skinned and cut down to 5 cm’s each. It is important to keep each sample the same size or I could risk affecting the osmosis rate and corrupting the entire experiment. Each of these sticks should be weighed and their mass recorded, hopefully each being the same so the test can be kept fair. I plan to have eleven samples, ranging from A-K. Each potato stick should be assigned a test tube with 25ml of water. Glucose powder is the variable in this investigation. It will be added into the test tubes of water to determine the different reactions of osmosis that will take place within the potato itself. Once the glucose has dissolved into the water a potato slice will be put into it and left for twenty-four hours for the experiment to occur. Over this time period many changes will take place, which are already explained above. After this time period I am to measure the mass of the potato stick and determine whether it has gained mass, reduced in mass, or even stayed exactly the same. Since chemical reactions are going to be taking place it would be safest to wear safety goggles whilst doing the experiment and to try make sure the solution doesn’t make contact with my skin because of a possible skin irritation. I am to measure the weight of each individual potato stick before the experiment and the weight afterwards, and record any change in mass.
For my experiment I intend to begin with 0g of glucose and work up to 5g with intervals at every 0.5g. This way I can see what the in-between stages of the reactions are and note any changes that will happen which could be significant to producing my graph and giving me much more accurate data. In order to achieve accurate results I require I must be extra careful when applying the glucose powder into the solution to insure none of it spills, meaning I will put the wrong measurement in. The results I get are going to be recorded in a table pre-designed with everything I need to know about the experiment to produce a later graph and computerised table to enhance the visual layout of my project. These results are to be recorded using an electronic scale to get the most accurate definition available and are to be taken after the twenty-four hour reaction time. I intend to use the following equipment:
- Test Tubes – these are to be used to store the potato sticks and the glucose solution, they are to hold 25 ml of water.
- Cork Borer – the cork borer will help me to cut eleven evenly sized potato sticks to help make the test fair.
- Electronic Scale – the scale will measure the mass both before and after the chemical reaction of osmosis has taken place. Because it’s electronic no human error can be made when analysing the results.
- Scalpel – the scalpel should be used in order to cut down each potato stick exactly the same size or as close as humanly possible. The edges of the potato should be cut into a right angle to make this job easier.
In order to keep the experiment a fair test I should make good use of the cork borer and scalpel and keep the potato samples as close to the same size and mass as possible otherwise the osmosis reaction and diffusion rate into the glucose could be dramatically altered unwillingly. I should make sure to measure each potato stick fairly and attempt to record each potato stick at the same time to prevent extra effects of osmosis occurring. For this I should get some of my group to measure at the same time. Accuracy is essential in this experiment; a small percentage of a number can make a huge difference on the results.
The equipment used in my experiment should all be of the same standard, each set up exactly the same as the last. The most important factor to consider is that I include the correct amount of water in each test tube, that being twenty five millilitres (25ml). In the case of the potato sticks all effort should be made to extract them all from one potato, this way the quality will not vary and every cell will have the same relation to each other. The room temperature should be kept constant and all samples should stay at the same temperature as each other, a hotter climate would cause the osmosis to react faster and vice versa for a colder climate.
In my investigation I intend to use eleven different measurements of glucose, those being 0g, 0.5g, 1g, 1.5g, 2g, 2.5g, 3g, 3.5g, 4g, 4.5g, and 5g respectively. Using such a wide and varied selection should give me an accurate account of the change osmosis goes through. I must ensure that these are given to as near the correct amount as possible to keep the experiment fair, and also measure the water to meet 25ml exactly. Since there is no electronic equipment on hand to do this for me I must trust my judgement.
Results
The following results are that which I got from the experiment:
Following is a graph that shows these results:
This graph should have showed a perfect curve, but due to the fact that the potato sticks weight differed just a little bit, the graph was transposed quite extremely. As it shows the change in mass is still fairly accurate compared to the concentration of glucose, and it gives more or less the correct information needed. Although not completely as accurate as it would be under a 100% fair test, it still completes and fulfils the task rather well.
Analysis and Conclusion
My results have been displayed as both a table and line graph shown above. These both show the relations between the percentage change in mass and the concentration of glucose. I chose to express these results in the form of a curved line graph because it shows the results completely accurate and a connection of patterns can easily be seen because of it. Because I done it computerised rather than hand drawn there is no possibility of me making a human error, so I felt this was a better way to design it.
On this above graph a clear pattern can be observed, the line seems to curve a lot. This curve shows the lower amount of glucose added to the solution, the greater the decrease in percentage of mass is. In theory this graph should have crossed the X-axis at 2.5g of glucose but due to human errors which could not be helped the graph was a little inaccurate.
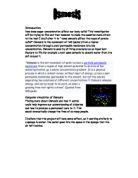
From these results it is clear that the more glucose added the greater the loss of percentage in mass. This is because the water particles are exiting the through the semi-permeable membrane in the potato sticks cells and diffusing into the glucose mixed into the water, a classic example of osmosis. Osmosis occurs through this semi-permeable membrane which exists in potato’s. it is a reaction described best as “the net transfer of water, through a semi permeable membrane, from an area of high concentration to an area of low concentration. This continues until an equilibrium of water gain/loss is reached, when equal amounts of water are coming in and out of the membrane, reaching a point of standstill”. This reaction should and did produce the curved pattern shown above on the graph. 2.5g of glucose should be this point of equilibrium in a completely fair test, but mine was more like 2.25g. Although this seems small it can make a huge change to the graphs appearance.