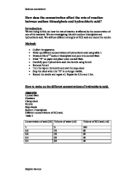
Here is a simple sketch of the graph I’m expecting the investigation to produce:
This predicted graph shows that the reaction rate increases slowly at first when the concentration of sodium thiosulphate is increased, then rapidly speeds up towards the end of the reaction.
Method:
Both the sodium thiosulphate and the Hydrochloric acid are solutions in water, so the concentration of either can be changed. However I have chosen to vary the sodium thiosulphate as it is available in larger amounts .When hydrochloric acid is mixed with sodium thiosulphate solution, a fine yellow precipitate of sulphur forms. The reaction can be followed like this:
1. A cross is marked on a piece of paper.
2. A beaker containing sodium thiosulphate solution is put on top of the paper. The cross is easily seen through the solution, from above.
3. Hydrochloric acid is added quickly and a clock started at the same time. The cross grows fainter as the precipitate forms.
4. The clock is stopped the moment the cross can no longer be seen.
5. I will then repeat the experiment several times to get an average.
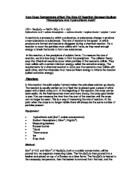
Diagram of the way in which, over time, the precipitated sulphur changes the transparency of the water until the cross finally disappears.
Plan:
Before I begin my main investigation perhaps a trial experiment would help me to check my method and determine which quantities and measurements would prove most effective. Firstly here is a list of the apparatus needed to carry out the experiment successfully:
- Timer/stop watch
-
1 ten cm³ measuring cylinder
-
2 fifty cm³ measuring cylinders
-
150cm³ of sodium thiosulphate
-
75cm³ of hydrochloric acid
-
100cm³ of distilled water
-
100cm³ beaker
- Piece of white paper with a clear black x drawn onto it
- Safety glasses
- Pipette
For both the trial and main experiments here are the measurements I will be using:
- A fixed volume of 5cm³ of hydrochloric
-
0-50cm³ of distilled water
-
10-50cm³ of sodium thiosulpahte
(The volumes of water and sodium thiosulphate are oppositely proportional, meaning if one’s volume is decreased for the experiment, the others must be increased to make a combined volume of 50cm³ always.
In my main experiment I will be testing each concentration three times whilst in the trial experiment I will just test the lowest and highest concentrations of water and sodium thiosulphate to see if they produce suitable reaction times. Here are the results for the trial experiment-
From my point of view the trial experiment produced excellent results which show that my planned volume of 5cm³ of hydrochloric acid is very suitable. The reasons for this are:
- The gap between the lowest and highest reaction times was large meaning the results in between these two will also be noticeably different and easier to record.
- Both opposite reaction times were quite high which means a delay in the recording of the times will not really affect the fairness of the test.
Before I begin here is a display of the apparatus I am going to be using and the proceedings in which they will be used in-
Range of results:
For this experiment I will be testing 5 different concentrations of sodium thiosulphate When the volume of sodium thiosulphate is at 10cm³, the water volume will be 40cm³ (equalling 50cm³ when combined always). From 10cm³, I will then increase the sodium thiosulphate up to 50cm³ (100% concentration), testing at every 10cm³ interval.
Fair Test
Safety:
To avoid injuring others or myself around me, I will have to follow the safety precautions, which are shown below:
- I will at all times be wearing scientific safety goggles to protect my eyes against any unpredictable splashes of hydrochloric acid.
- All spillages and leakages will be immediately cleaned up from any surfaces.
- Equipment will have to be replaced after I finish using them
- I will move carefully around the room.
- To prevent disorder any items that are not necessary will be stored in a safe place before I start the experiment.
- Pouring of chemicals needs to be performed slowly and carefully.
- The same applies to the carrying of apparatus.
Results:
Reaction rate = 1 Molar mass = amount of sodium thiosulphate
Average time
Conclusion:
Looking back at the overall results I can confidently say that they prove that when the concentration of the reactant, sodium thiosulphate, is at its highest the reaction rate is at its fastest. My results seem to support my prediction that with increasing concentration the rate of reaction speeds up. I also predicted that by doubling the concentration of sodium thiosulphate eg. from 10cm³ to 20cm³ (20% concentration to 40%) or from 20cm³ to 40cm³ (40% to 80% concentration), the rate of reaction would double. The results do not entirely indicate this to be the case though because at 20% concentration, the reaction rate was 0.004 whilst at double the concentration, 40%, it was 0.009 and at 80% conc. the rate of reaction was 0.017, actually just under the rate at 40%. We see from this that although the rate of reaction did not exactly double each time the concentration was doubled, it still increased dramatically to more than ,or just under, double. So looking at the graphs, I can see that as the concentration of sodium thiosulphate increases the time taken for the reaction to take place decreases, which means the rate of reaction, in contrast, increases. This is due to the amount of particles in the solution being greater and closer together causing the colloids to collide more often with a higher probability of success. When you double the molar mass of the thiosulphate you should expect to see the rate of reaction to double also, which it approximately did. We can see evidence for this in that when the molar mass of sodium thiosulphate was doubled eg. 0.05 to 0.1, the reaction rate approximately doubled from 0.004 to 0.009. I also worked out the gradient for the relationship between the rate of reaction and the concentration of sodium thiosulphate. It was 1.2 which shows that the rate of reaction figure increased by this number of centimetres on the y axis every time the concentration was increased by 10cm³.
The graph displaying average time corresponding to concentration of sodium thiosulphate has quite strong negative correlation meaning that as one value increases the other decreases which proves the idea that when the concentration increases, the average time decreases. The reaction rate graph though has a positive gradient meaning both values have near proportional increases. As the concentration of sodium thiosulphate is increased, the reaction rate increases. We can also see in the ‘average time graph’ that the gap in between co-ordinates increases as the points move towards the y axis. This means that the average time for the cross to disappear increases more and more as the frequency of sodium thiosulphate particles decreases by an equal margin each time. If you look at the various gradients of this line though you should notice that the steepness of the graph is actually more intense when the concentration of sodium thiosulphate is 80-100cm% than when it’s at 60-80% (a higher steepness represents a faster decrease in time it takes for the cross to disappear). The results indicate that at the lower of the two concentration ranges the gradient of the line is 0.35 and 0.4 when the concentration is higher (80-100%). This shows us that the rate that the average time decreases between 60-80% concentration was slower than at 80-100%. This only means that although the average time before this decreased at a dramatically increasing rate, when it got to 60-80% concentration it was slightly slower compared to at 80-100%. This may have been down to chance where an increase in successful collisions of sodium thiosulphate particles may have occurred. The difference in rate of decrease is not dramatic so it may come down to some anomalous results for these concentrations because the difference in average times between 60% conc. and 80% conc. is 13 seconds, whilst the difference between 80% and 100% is 15 seconds, which shows a 2 second faster increase in rate of decrease of average time. I think this dilemma can be resolved by looking at one of the results for the reaction time at 60% concentration. This particular time was 63 seconds which was considerably smaller than the other results for this concentration which were 78 and 75 seconds. This meant that the average time for this individual concentration was too low and too similar to its next higher concentration’s results. This evidence of an anomalous result proves why there was a slight break in the trend so further testing should show that it was only down to this diverse reading that there wasn’t a steady rate of decrease in the average time of reaction.
Evaluation:
I think the experiment was very successful because it was very effective in proving how the rate of reaction is affected by varying levels of sodium thiosulphate when mixed with hydrochloric acid. There were various anomalous results though eg. the times for the cross to disappear from sight were not consistent throughout the repeat readings. This might have been due to basic human error of misinterpretation of time, or maybe because we measured the substances inaccurately. The only other possibility is that the apparatus were not cleaned properly in between testing. Most of my results support my prediction, except for the few results that were only slightly anomalous (circled in blue on graphs and tables) which proved a majority of the time insignificant to the average reaction times anyway. The reason that on two of my graphs the points circled blue are only straying from the line of best fit by a very small margin is that they are based on the reaction rates of those concentrations, which is given by looking at the average times. What I mean by this is that the circled points on the two graphs only indicate that for that concentration an anomalous reading was noticed out of the three reaction times which is then circled in blue in the tables. The repeat readings always when given a mean figure showed a general reaction rate that proved to be similar to my prediction where when the concentration of sodium thiosulphate was doubled, I predicted the rate of reaction would also double eg. for 80% concentration the times were 62, 65, and 51 seconds, the latter the anomalous result of the three. When averaged off though that particular concentration produced an average time of 59 seconds. This mean fit in with the trend where the average time decreased as the concentration of the sodium thiosulphate was increased. These anomalous results are exposed by the lines of best fit where they can be clearly seen ‘straying’ from the path. I was very careful measuring the chemicals out, so I believe this is why I had a majority of results that seemed more relative to the rules of the collision theory and the effects of concentration on a reaction.
I would have been able to improve the experiment by using a light sensor instead of visual judgement to determine more accurately the exact moment the cross disappeared from view. The light sensor would measure accurately when the solution reached the same degree of cloudy-ness in all repetitions. This would make the experiment much fairer because the same would apply throughout. This would have made my results more accurate. It was a relatively fair test though, because my only variable was the concentration of the Sodium Thiosulphate solution. I would have liked to repeat the experiment again to confirm my results if I had had more time to do so. Also, if we had had more time I would have liked to use a wider range of concentrations to see if the patterns that have developed continued. For example, I could do an experiment where I varied the concentrations of hydrochloric acid and used a fixed volume of 5cm³ for the sodium thiosulphate. This might not be as effective though because as hydrochloric acid is far more reactive than sodium thiosulphate (which is why I used such a small amount of HCl for my main investigation), it would mean the reaction rate would be too fast and more difficult to record. I could also test much higher volumes of sodium thiosulphate so I could compile a larger set of results to observe the extent that my lines of best fit reach to and to see, if ever, where the curve on the reaction rate graph develops into a horizontal line. Altogether though I think my results were quite reliable because I kept to the safety and fair test regulations, and they have been proven reliable by the same trends appearing in sequence rather than results with little correlation.
References: The essentials of Edexcel Volume One, The Laboratory Companion: A Practical Guide to Materials, Equipment, and Technique.