An Endothermic reaction is a reaction that absorbs energy, normally in the form of heat. This is the opposite of an exothermic reaction and is observed by a decrease in temperature. An example of an endothermic reaction is photosynthesis or the break down of calcium carbonate into calcium oxide and calcium dioxide. Some endothermic reactions require more energy than can be provided just by absorbing heat from surroundings at room temperature. For example, to break down calcium carbonate to form calcium oxide and carbon dioxide, it must be placed in a container and heated over a flame.
Exothermic Reaction:
Endothermic Reaction:
Apparatus
Alcohols:
Ethanol
Methanol
Pentanol
Butanol
Propanol
Timer
Aluminium Tin
Thermometer
Water
Beaker
Tripod
Stand
Method
- Set up apparatus as shown:
- Use a beaker to measure the correct quantity of water.
- Place water in tin and take temperature.
- Get first alcohol and weigh. Record and then burn for time stated.
- Take temperature at end and the weight of alcohol.
- Replace tin and start at step 2.
Prediction
I think that in the main experiment, the alcohol with the longest carbon chain will give out a lot more energy.
Methanol
Energy required to break bonds = +2806.5 kJmol-1
Energy released when bonds are made = -3343 kJmol-1
ΔH = -539.5kJmol-1
Pentanol
Energy required to break bonds = +10476.5 kJmol-1
Energy released when bonds are made = -13018 kJmol-1
ΔH = -2541.5 kJmol-1
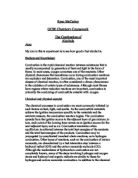
Here is a hypothetical graph of what I think my final graph should look like:
Preliminary Work
In class, we did preliminary work to calculate correct volumes and time. We did this with the alcohols;
- Methanol
- Ethanol
- Propanol
- Butanol
Here are the results:
Here is a graph to show my results from this table:
Conclusion
From my experiment, I can say that as the length of the carbon chain increased, the heat energy given out also increased. The 4 alcohols that I used (Ethanol, Methanol, Butanol, Propanol) were placed under a tin can of water and burnt for the set amount of time. The graph shows that during this time, Butanol produced the most heat energy, and Methanol the least.
Looking at my graph, the line of best fit (in blue) is a line, but the individual points are not all on this line. These results (and graph) match the results in my preliminary work. This is good, because it shows me that my results are somewhat correct because they match. This makes the results more accurate and reliable.
Evaluation
I made my experiment accurate by using a digital thermometer, so that I could record the temperature to 2 decimal places. This is much more accurate than using a normal thermometer because I could get errors from that.
I also checked that my results were precise by repeating the experiment again. I then used those results to make an average of the previous results and then used the averages to make my graph.
As you can see, the results in my preliminary work match my main results; this is also followed by the hypothetical graph in my prediction, which also matches my results.
If I were to do the experiment again, I would improve it by doing the following things:
The results that I got were quite accurate, as we did the experiment 3 times. From these results, I then took an average. This is what I recorded on my results table. The procedure was quite complex, and in my group we decided to use a draft excluder. These prevented a draft moving the flame away from the tin can which could change the results that I got.
- Work in a larger group, not just two people so that the experiment would not have as many timing limitations.
- Use more than 4 alcohols (Pentanol)