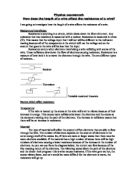
R= I / Gradient: You’ll get one value of resistance.
The steeper the graph, the lower the resistance. A substance that gives a straight graph like this is called an ohmic conductor. A good example of an ohmic conductor is copper wire. In fact, all other metals give this shape of graph unless they change the temperature.
Higher temperature – power out
P= V I V= IR
P= I R I = I R
Other voltages graphs:
A Filament lamp
You can see this voltage graph is a non- ohnic conductor.
As more current flows, the metal filament gets hotter, and
its resistance increases.
Thermistor
As more current flows, the Thermistor gets hotter and so its
Resistance decreases the graph steeper.
Diode
Almost no current flows if the voltage is applied in the reverse direction whenever the V is more than about 0.6 volts.
Resistivity:
All metals are not equally good conductors of electricity. An example of this is the metal nichrome; these wires have a higher resistance than copper wires.
The resistance of a wire at a constant temperature depends on,
- Its dimensions
- The material which it’s made from
Every material has a property called its resistivity p.
It is measured in ohm meters (Ωm)
p. Is the Greek letter ‘rho’
Material Type of Material Resistivity / Ωm
Copper Conductor 1.7 10
Nichrome Conductor 110 10
Silicon Semi-Conductor 2.3 10³
Glass Insulator 110
Resistance, R= resistivity, p (ohm meters) length, I (meters)
(Ohms) Cross-sectional area, A (square meters)
Or…
R=pl
A
The resistance of a wire is proportional to its Cross-sectional area
Resistivity is defined as numerically equal to the resistance, a sample of the material of unit length and cross sectional area.
Apparatus required:
- Power Pack
- Ammeter
- Crocodile clips
- Voltmeter
- Material (wire which will be measured)
- Rheostat ( variable resistor)
- 1m Rule
- Wires
Below, is a diagram of how the apparatus will be connected together.
Safety:
Safety is an important issue when doing an experiment; you must remember to…
- Wear safety glasses in case the wire breaks or burns
- Carry out the experiment on a clean level surface, not in wet areas as water is a very good conductor of electricity therefore it will affect the resistance
- Tie up your hair
- Make sure no plastic or other materials are in between the measuring length otherwise the heat will cause it to burn
- Be careful not to touch any heated, naked wires until the power supply is switched off
- Handle the power supply carefully, make sure you don’t start with a high voltage
- Make sure there is no object around you which may cause an accident
- Make sure your hands are dry especially because this is electricity
- Not to let the wire to get too hot or else it will burn
- Make sure the circuit is properly connected before switching the power supply on
To ensure a fair test:
In order for the experiment to become a fair test, I will only change only one variable at a time. Also for the temperature of the wire I would have to switch of the power pack every time I measure one length of the experiment. Making sure the temperature will not gradually (rise) increase. In my final result table I will do repeated measurements three times then find the average to achieve accurate readings. I will keep the power supply the same throughout the different lengths.
The factor I will be investigating is the length, as I want to find out how does the length of a wire affect the resistance of a wire. To do this I will be taking down the voltmeter reading and the ammeter reading for every 20cm length. From the range of 20cm to 100 cm that means for the preliminary results I will be taking 5 results. There are other factors that may affect the experiment, which are the temperature, diameter and material of a wire. I must keep these factors constant, as it would be an unfair test if I changed more than 1 variable at a time. The factor I will be changing is the length. To keep the temperature constant I will need to quickly switch off the power supply every time one length is measured. This would mean the wires would not have a high temperature before the actual length is measured. To keep the diameter and the material of the wire the same, I just simply keep and use the same wire throughout the whole experiment until the all lengths are measured. In the main method, I will take repeated measurements to allow me to take an average result giving more precise results.
Prediction:
I predict that if the length increases then the resistance will also increase in proportion to the length. The reason is because the longer the wire the more atoms and so more likely the electrons are going to collide with the atoms. If the length doubles, the resistance should also double. If the number of atoms double, it will result to a larger chance of collisions slowing down the electrons increasing resistance. I also predict that at 2 volts, the resistance will be less than at 3 volts because the energy between the atoms shall be less so they will be moving around less. Resulting in fewer collisions between the flowing electrons and the atoms therefore it has less resistance. Resistance means the property of anything to constrict the flow of electrons. The electrons that carry energy within the metal collide with atoms inside the wire and change in direction. This is known as scattering. Scattering, causes electrical resistance. Therefore I can predict that the electrons will collide with the atoms, when the atoms have more energy, more often.
Method:
First of all gather your equipment, which are mentioned earlier. Check all safety precautions also mentioned earlier. When all safety is completely checked plug in the power pack into the socket. It is the power pack that will provide the set voltage. From the ammeter, a crocodile clip will be connected with the other end connected to the meter wire at 0cm. This will remain here, as it will simply be reading the current from this point whilst the wire from the voltmeter varies along the wire. The crocodile clip from the voltmeter is connected at 10cm and is repeated at 20, 30, 40, 50, 60, 70, 80, 90 and 100cm. The ammeter would remain at 0 to record the variables, as the distance from 0 to the recording does not need to be calculated. The voltage on the power pack will be set at 3 volts, and I will take the results tree times which then I will find the average result, using the voltage sand current readings I will calculate the resistance applying the V/I formula.
Preliminary results
For my preliminary work, I set up the experiment as said so in my method and took some readings. It helped me realised any mistakes that I was making that would affect the real experiment. Those were things such as turning the voltage too high, which would be quite dangerous and could have burnt the wire. I also took the readings from the ammeter and the voltmeter too quickly and did not let the value settle before taking it. This would only make a small difference to the results but accuracy is the main part of any investigation. From these results, I have also decided to do a repeated measurement, three times to achieve an accurate result in the main experiment. I also will find the resistance of every 10cm length, instead of every 20cm keeping the measurement range the same, from 10cm tom 100cm. This will help indicate see that it obeys ohm’s law, which is, as the length increases the resistance a clearer result.
My preliminary results showed that as the length increased the resistance increased. This agrees to my prediction, looking at the graph most or all my results were very close top the line of best fit. There were no obvious anomalous results. The graph also showed as length doubled the resistance also doubled, although, they’re not so accurate.
Results Table
Results table (when current is constant)
Analysis
From my graph it is clearly seen that there is a very positive correlation. As I drew the line of best fit, I saw that most of my results were very close to the line, which meant quite accurate. It was a steady line, which increased. This is because the resistance is proportional to the length of the wire the resistance is also doubled (it obeyed ohms law). When the wire is longer to pass through the wire, creating more resistance as mentioned in my prediction. Therefore, my prediction was correct.
The scientific term why this happened was stated in the planning that if you double length, you double the number of atoms in it. Doubling the number of electron ‘jumps’, which causes resistance: The results support my predictions well, the results turned out the way I had expected, and they match the predicted line well. I had predicted a straight line through the origin, which means Resistance, is directly proportional to Length. This is shown in the graph, the longer the wire the more resistance there was. But the doubling of resistance and the length did not match up 100% correctly. This must have been because of a slight accidental reading.
I notice that there weren’t any obvious anomalous results as they were all close to the line of best fit. I did have a few just missing the line a little. This may have caused due to the limited time or it may have been because my group and I read the readings wrong. Ohm's law states that the current flowing through the circuit is directly proportional to the voltage applied. (If you double one, you double the other.)
I worked out the resistance of the wires by using the formula:
V/I = R or
I put my results into graphs. I had to draw a line of best fit on all the graphs because there were a few anomalous results.
The experiment was conducted quite well, generally everything agreed to my prediction.
Conclusion
From the results, I have come to conclusion that if you increase the length of a wire its resistance also increases. I think this was because of a increase of amount if atoms in the wire at each ascending length and so if there were more atoms then there would be many collisions between them and the electrons therefore causing a lot of electrical friction consequently resistance. My graphs clearly showed reliable results, as there were no obvious anomalous results. They also showed me that as you double length the resistance doubles as well. But this wasn’t so accurate this may have been because the experiment may have been slightly rushed. This experiment has agreed with my prediction, it was correct that as the length increases then the resistance will also increase in proportion to the length. The main reason this happened was due to the more atoms in longer wires colliding with electrons.
Evaluation
I think that my experiment has been successful as most my results supported my prediction. My results became more accurate as each length was taken 3 times at the various voltages and that allowed me to calculate an average from my resistance. The preliminary test showed me what lengths I should use and the voltage that was most suitable for the main test.
From this test, I found out that I should use lengths from 10 to 100cm. I also found out, that using a high voltage about 1.6v the wire started to burn therefore I used voltages under 1.6v. The preliminary results and graphs showed me that the wire obeyed Ohms Law. As the length of the wire increased and the voltage varied, the resistance also increased. The results I had were quite accurate mainly the results were close to the line of best fit. Although, I did get accurate results, I still decided to take repeated measurements for each length three times.
In the main test, I took three readings for each length; this allowed me to take an average value of resistance. The results from this test were more accurate then the preliminary ones, there were no obvious anomalous results but a few just came off the line of best fit.
We read directly over the meters to see where the needle was pointing so there is less chance of parallax error. If we had read it looking from the left or right side, we may have read the wrong current and therefore we will work out the resistant incorrectly. We could have used digital meters as these will record the resistance to two decimal places and there would be no chance of making a parallax error.
If I were to do this experiment again, to achieve more precise results I would need to clean the crocodile clips to ensure that there is no rust on them. I would use a digital voltmeter and ammeter. Finally, I would lower the current to make sure that the wire does not burn, as this will affect the resistance; it will not be a fair test.
An alternative method would be to include a data logger, and using a computer as it would give me more accurate result. Also using digital voltmeters and ammeters.