Aim
I am trying to find out how the length of a wire affects the resistance of a wire. I am going to change the length of the wire but the material and thickness of the wire the same. Also I am going to keep the current constant, so that the temperature doesn’t increase and therefore the resistance will not increase either.
Preliminary
I set the circuit as shown in the diagram and took readings for 10, 15, 20, 25, 30, 35, 40, 45 and 50 cm length wire.
Preliminary Results
The results were as expected because as the length of the wire increased the resistance increased too. The link between the wire length and the resistance was directly proportional.
As my preliminary results did not provide a very wide range of results, when I carry out my experiment I will take results from 20-100 in intervals of 20.
Prediction
I predict that the longer the piece of wire, the greater the resistance will be. This is due to the idea of the free moving electrons being resisted by the atoms in the wire. In a longer piece of wire, there would be more atoms for the electrons to collide with and so the resistance would be greater. The relationship between the wire length and the resistance should be directly proportional. This is because in a wire twice the length of another wire there would be double the amount of atoms causing the resistance.
An example of this would be in a 20cm wire. The electrons would have to travel double to distance if it have to go through a 10cm wire. This would in turn double the amount of atoms that the electrons would collide with and then resistance would double.
Expected Graph
Resistance
Length
Apparatus
- Constatine Wire
- Ammeter
- Voltmeter
- Powerpack
- Metre ruler
- Variable resistor
- Crocodile clips
- Connecting leads
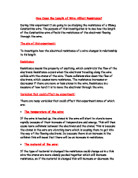
Diagram
Method
Connect the circuit as shown in the diagram above.
- Check the ammeter to see if it reads zero, when reading the scale work out each small line first. Make sure you read scale accurately.
- It is important to connect the ammeter so that the positive terminal is always near to the positive pole of the cell rather than to the negative pole.
- Make sure that the voltmeter is in parallel across the wire.
- Change the length of the wire to acquire a good range of results.
Fair Testing
To ensure that the investigation is carried out in a fair way and that the results will be accurate and reliable, a number of procedures must be followed:
- The only variable in the test will be the length of the wire.
- The wire must be pulled tight against the ruler and taped in place to ensure the length is accurately measured.
- I will set the experiment up accurately and keep the Power pack charge the same at all times (measured in volts).
- The experiment should be repeated 2 times and an average should be taken to make sure that the results are reliable.
Safety
To make sure that this test is carried out in a safe way, I will ensure that none of the wires are frayed and that there is no water near any electric equipment.
Results
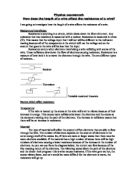
Analysis
The results from the graph on the previous page give a clear indication of how the resistance compares to the length of the wire. The graph is linear, and there is a very strong positive correlation. This means that when the length of the wire increases, the resistance also increases proportionally. An example would be at a wire length of 50 cm, the resistance is 0.5 Ohms and at 100 cm it is 1.0 Ohms, this is exactly double the size.
In any given metal wire, there are a number of atoms and free moving electrons. Electricity is the movement of these electrons through the wire. Resistance is caused when the free electrons moving through the wire collide with the atoms making their path through the wire more difficult. This means that if there are more atoms in the way to collide with the free electrons the resistance is increased. In a length of wire there will be a number of atoms, and in a wire twice the length, there will be twice the number of atoms.
The results that I have obtained support my original prediction. This is because in the prediction I said that as the length of the wire increased, the resistance should increase. I also said that the link should be directly proportional. The results and graph pattern have shown that this is true.
The graph is valid as the points are all on the line of best fit. Also there are no anomalous results, so this clearly indicates that the graph pattern is valid.
Evaluation
My results table and graph prove that my results that I collected are very reliable. I collected two sets of results and worked out the averages before plotting the graph, this suggests that my results are reliable, as I tried the experiment more than once. There were no anomalous results on my graph and all the points lie on the line of best fit, this shows that my results are quite accurate and reliable.
Overall the method used was suitable for my experiment. However, in order to obtain more reliable and accurate results, improvements could be made.
To improve on my results I would:
- Use a digital voltmeter instead of an analogue meter. I would do this because a digital voltmeter is a lot more accurate than an analogue meter. Also if the needle in the analogue voltmeter is bent then the readings given off will be incorrect whereas a digital voltmeter does not rely on a needle or any other manual movements.
- Use pointers instead of crocodile clips, I would do this because pointers would be more accurate. The pointers tips have a much smaller area than the crocodile clips giving a more accurate measurement of the length of wire.
As well as making these modifications I could also extend my investigation by testing the same wire but different thickness of that wire, in order to see the effect on the resistance of the wire. The method would be the same except instead of the length of the wire being the variable that is controlled, this time the variable would be the thickness of the wire.