As it says in ‘Complete Physics’ by Stephen Pople, there are four main factors affecting resistance. They are length, cross-sectional area, material and temperature. I will therefore leave them all the same (except length) to make it a fair test.
For equipment, I will need a;
- Voltmeter
- Ammeter
- Wires
- 1m of nichrome wire
- Power Pack
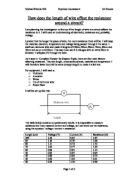
It will be set up like this:
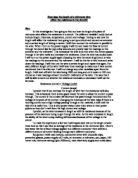
The table below contains my preliminary results. It is impossible to measure resistance but I can measure current and voltage, so I can work out the resistance, using the equation ‘voltage / current = resistance’.
The results in the preliminary results were very good and they were no anomalies. Below are my actual results.
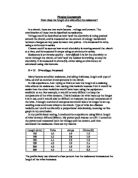
From this evidence I can see that the longer the wire is, the more resistance there is. The only trend is that the amount of resistance decreases as you go down the table. This also proves that my original prediction was correct and I needn’t make another one. This graph shows how the length of wire compares to the amount of resistance passing through it. Because I measured the length, it goes along the bottom axis. The length is the independent variable.
Although the points are a little scattered, the line of best fit is in the best place. I did not measure 0cm or 10cm of nichrome wire so they do not appear on the graph. One point has been rejected as an anomaly but it hasn’t gone too far out so it’s not much to worry about. From this information, I can conclude that because the length of the wire is bigger, it is harder for electrons to ‘push’ through the wire and more resistance. This conclusion fully supports the prediction, so the experiment was successful. Some of the wire may have been slightly dented so it was not completely fair and this probably affected the resistance and may have caused the anomaly.
The procedure was very good and I thought I worked well. The evidence obtained is pretty reliable but dents and bends in the nichrome wire may have affected it. Some measuring may have been slightly dubious as well so this is likely to influence it. I could make some changes to this. Repeating the experiment once or twice more could have given me a more accurate readings. The evidence could support a perfectly good conclusion, because even though there is one anomaly, it still follows in with the pattern. I could try a second experiment but changing perhaps cross-sectional area or temperature to see how that impinges on my table of results.