Prediction:
I predict that when I increase the temperature, it will increase the rate of reaction. As a general guide raising the temperature of a reaction by 10°c will double the rate of reaction. I think this because when a mixture of substances is heated, the particles are heated up with thermal energy and will move faster (increased kinetic energy). This has two effects. Since the particles are moving faster they will travel a greater distance in a given time and so will be involved in more collisions. Also, because the particles are moving faster a larger proportion of the collisions will exceed the activation energy and so the rate of reaction increases.
This means that when I draw my graph in my results it will probably have a positive correlation and will probably be curved, as the increase in rate of reaction will not be exactly the same as the temperature is increased.
Preliminary work:
I did some preliminary work with sodium thiosulphate to see if increasing the concentration would affect the rate of reaction. The table below shows the concentration of the solutions used. The same apparatus was used as I will describe for my main experiment on temperature except this time I used a conicle flask and a cross and I observed when the cross disappeared.
Results to show how the concentration of sodium thiosulphate affects the time it takes for the cross to disappear.
These results show that the higher the concentration of sodium thiosulphate the quicker the cross disappeared because more sulphur was precipitated more quickly.
In my main experiment I chose to use an average concentration (30cm³ sodium thiosulphate, 5cm³ of hydrochloric acid and 20cm³ of water) which was a concentration of 0.09 mol/ cm³, so that I could use a longer time span e.g. 0-100 seconds to see the effect on the reaction of increasing temperature.
NB the reaction only starts when hydrochloric acid and sodium thiosulphate are added together.
Experiment to show how does the temperature of the sodium thiosulphate affect the rate of reaction with hydrochloric acid.
Apparatus:
- 1 ten cm³ measuring cylinder
- 2 fifty cm³ measuring cylinders
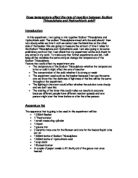
Experiment plan:
Method:
To successfully complete my experiment I had to complete the following steps.
- I set up the equipment the same as I decided to in my experiment plan.
- I collected my measurements of sodium thiosulphate, hydrochloric acid and distilled water. The measurements for these are below:
Sodium Thiosulphate – 30cm³ (use a 50cm³ measuring cylinder)
Hydrochloric acid – 5cm³ (use a 10cm³ measuring cylinder
Distilled water – 20cm³ (use a 50cm³ measuring cylinder)
- I placed each of the measured solutions in a thermostatically controlled water bath and only mixed them together when they had reached the correct temperature. In between temperature changes the flasks were cooled before fresh solutions were added.
- I will repeat that step three times for each temperature I test; I will then calculate the average of each time per temperature. (I will calculate the average by using the mean)
Fair Test:
To make my experiment fair, I will always keep everything the same apart from one variable or effector. I will measure all the sodium thiosulphate to 30cm³ and all the hydrochloric acid to 5 cm³ and all the water to 20 cm³ so that there is the same volume of atoms in the solution.
The table below shows a list of variables and whether they were controlled throughout the whole experiment or if they were changed.
Accuracy:
To make my experiment accurate I was very precise measuring the ingredients, I made sure I did the experiment exactly the same way each time I repeated it.
I double-checked any unusual (anomalous) readings and I repeated the experiment three times and used the mean (average) results.
Safety:
To avoid injuring others or myself around me, I followed the safety precautions, which are shown below.
- I wore safety goggles at all times
- All spillages and leakages were immediately cleaned
- Equipment was replaced after I had finished using them
- I did not run around the classroom or not loom where I was going
- Any items that were not necessary were stored in a safe place.
Results:
I collected the results of my experiments in the tables shown on the next few pages.
A table was drawn for each of the following temperatures used 20°c, 30°c, 40°c, 50°c, 60°c. Each temperature was repeated three times, and then an average was calculated, adding the three values together and then dividing them by three did this.
E.g. 1.76 + 1.83 + 1.81 = 5.40
5.40 divided by 3 is 1.79
Discussion:
The tables show a trend, that with increasing temperature the reaction rate speeds up because the light sensor shows less light is getting through the mixture. The reaction rate seems to be greatest at the beginning, as soon as the reactants are mixed. Higher numbers show more light is getting through and lower numbers show less light is getting through. As the reaction goes on, more sulphur is precipitated which blocks out the light so the light level drops. It levels when the reaction is over and the light level does not change much more. The slope of the line gives the rate of reaction. Between 20°c and 50°c there appeared to be only a small difference in the rate of reaction times, but then at 60°c the change was quite dramatic which shows at hotter temperatures the reaction was a lot quicker.
Conclusion:
My results seem to support my prediction that with increasing temperature the rate of reaction speeds up. I also predicted that by increasing the temperature by 10°c each time, the rate of reaction would double. This does not seem to have been the case but the rate of reaction did increase. So using the graphs, I can see that as the temperature increases the time taken for the reaction to take place decreases. This is because when the temperature is increased the particles will have more energy and thus move faster therefore they will collide more often and react successfully.
Evaluation:
I do think my readings were accurate because I went through a number of procedures to make sure I did not make the test unfair. I repeated my experiment three times at each temperature to make it more reliable, the readings each time I repeated the test were slightly different but the average shows the correct trend. They could have been different if I did not keep the temperature the same when needed and if I had the wrong amounts of ingredients instead of the exact amount but they were similar enough to show that there were no great changes.
The results in graph form seemed to confirm my predictions and most of the points were close to the best-fit line.
I do think I took enough readings because the graphs all tailed off as the reaction slowed.
I do think my method was good because it was easy to keep the apparatus; solutions and the order of work the same. The only difficulty was keeping the temperature constant and possibly it may have cooled a few degrees during the course of the experiment, which was confirmed by keeping a thermometer inside to measure the temperature.
The apparatus and the way I took the readings was good as I always kept everything the same and made sure the light sensor was reading the correct part of the liquid.
I made sure I used a good range of readings with the same sufficient amount of intervals as it was constant and they were all read after the same amount of time.
If I did the experiment again the improvements I can suggest would be to keep all the solutions in a water bath at a constant temperature throughout the whole experiment. Also I could repeat the whole experiment but this time using the cross on the paper underneath the conical flask to compare with the light sensor. The other questions I could investigate on the same topic are if chemicals react in the same way if they are done in cold temperatures going lower.
References:
McDuell B, Booth G, 1997, GCSE Science and chemistry classbook, Letts educational books, London.
Ted Smart, 1998, Science Encyclopaedia, Kingfisher, Somerset.
Stuart Thompson.
Also to support my prediction and to make my results clearer, I used a 1/t chart. This chart takes the average light value from each temperature where the reaction finishes.
First of all I plot these results in temperature, end reaction time and 1/t. this is shown below.
- 1/t is calculated by: 80 ever 1 =0.0125
- The end reaction time is calculated by looking at the graph and seeing where the light value begins to repeat or slows to no activity.