How does varying the concentration of Hydrochloric acid in reaction with Marble chips affect the rate of Carbon Dioxide being given off?
Rate of reaction.
How does varying the concentration of Hydrochloric acid in reaction with Marble chips affect the rate of Carbon Dioxide being given off?
Hypothesis:
Chemical kinetics, the study of reaction rates, shows that three conditions must be met at the molecular level if the reaction is to occur:
* the molecules must collide
* they must be positioned so that the reacting groups are together in a transition state between reactants and products
* the collisions must have enough energy to form a transition state and form into products
Some reactions need energy to react, others are spontaneous once all reactants are mixed. When a solution of substances doesn't need any energy to react it is said to be unstable, that is due to the substances having enough energy in their molecular collisions to form a transition state (the state in which both chemicals have broken apart either from their old pairs or from it's own bond and are about to form a product by bonding with the other reactant). Other reactions won't react unless they are given some extra energy, when temperature is increased the molecules collide more and at a greater speed, therefore at some point (different for all reactions) the reaction will take place.
Aim:
To investigate the effect of varying the concentration of Hydrochloric solution on the amount of Carbon Dioxide given off from the reaction (also investigate other possible conditions under which the speed of the reaction changes):
Marble is defined as: crystalline compact variety of metamorphosed limestone; therefore we can say that it contains same chemicals in same proportions as limestone, just a different chemical arrangement, which in our case is irrelevant to the equation:
CaCO3 + 2HCl(aq) ? CaCl2 + H2O + CO2?
Plan:
When an experiment is carried out, records of pervious experiments are taken into account. This type of information is called "Preliminary data", it is used to get a general picture of what the outcome should look like, it can also be used to predict the general behaviour of the experiment.
Preliminary data shows that when the temperature is constant then the increase is constant (a graph from preliminary data used is included). A table of the data is below.
It is apparent that although the line of best fit is straight it doesn't touch nearly half of the points, that is due to the results being very varied and reasonably unpredictable. This could be due to human error, such could be:
* wrong measurements while weighing
* error while diluting the acid concentration
* incorrectly screwing the cork into the collection cylinder, which would mean that some water leaks out and some bubbles get inside
To carry out this experiment properly, following measures must be taken:
. There must be a diagram of the apparatus that is being used in the experiment
2. All items used must be listed before they are ordered
3. All measures taken must be written down into a table
4. Measures must be taken to make sure that this experiment is a fair one
5. Safety precautions must be taken to make sure that no harm is caused to the person carrying out the experiment.
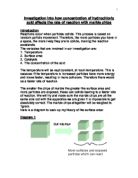
The diagram of apparatus used is included. It can be seen that the reaction happens in the test tube, then the cork blocks the way out for the gas and it is forced through the straw, under the water and bubble up into the measuring cylinder. This type of measurement is called "Collection over water". It is reasonably precise and reliable although takes long to set up and change to do each measurement.
Apparatus:
* conical flask or a two-sided test tube
* two corks, one to fit a 10ml cylinder, other to fit 100ml cylinder
* plastic hollow tube
* two beakers to act as a water bath
* scales, accurate to 0.01g
* Bunsen burner
* tripod for the flask to stand on
* thermometer
* stopwatch
Chemicals and substances used are:
* HCl (Hydrochloric Acid)
* CaCO3 (Chipped Marble. Notice, the marble proportions and dimensions are different from those used in the preliminary experiment)
* ...
This is a preview of the whole essay
Apparatus:
* conical flask or a two-sided test tube
* two corks, one to fit a 10ml cylinder, other to fit 100ml cylinder
* plastic hollow tube
* two beakers to act as a water bath
* scales, accurate to 0.01g
* Bunsen burner
* tripod for the flask to stand on
* thermometer
* stopwatch
Chemicals and substances used are:
* HCl (Hydrochloric Acid)
* CaCO3 (Chipped Marble. Notice, the marble proportions and dimensions are different from those used in the preliminary experiment)
* H2O (For the water bath)
* To make sure that this experiment is a fair one following measures are to be taken:
* When measures are taken the thermometer should be closely watched to make sure that the temperature stays at the required level, otherwise the reaction will change rate and measuring it will be pointless.
* When weighing the marble chips they must be as close as possible to weighing the same amount; they must also be the same volume and have the same surface area, that is because if one batch has a higher surface area than the other then the reaction will occur faster due to particles having more contact and vice versa.
* When diluting the substances (water and hydrochloric acid) the measuring cylinders must be washed after every measure has been taken, otherwise remainders of the previous substance will mix with the current solution, contaminating it and making the experiment unfair.
* Before and after weighing, the marble chips must never be handled by bare hands, if such should happen then the measurements will not be precise due to sweat from the hands being planted onto the reactants and therefore giving them a false mass.
* The stopwatch must be started as soon as the reactants have been sealed in the container, so the measurement starts when the gas begins to build up.
* The time gap from when the reactants are in contact and the container containing them is sealed should be same for every measurement, so that although some gas may escape, so it will but in equal proportions for every measurement, making the experiment a fair one in relation to it's other results.
* When carrying out the experiment all variables must be kept constant apart from the one being measured. If more than one variable is being changed then they must be changed at different times, the appropriate way to ensure this happens is to keep all variables constant, whilst changing one of them, then change the other variable whilst keeping the previous constant.
*
Safety precautions to be taken are:
* When handling the chemicals no contact should be made between the person carrying out the experiment and the chemicals.
* When working with the Bunsen burner it must always be on the yellow flame (the weakest one). This way not only is there less chances of someone either not noticing it whilst it's on the blue flame or burning themselves in a worse way than on yellow but also it would help making the experiment more fair by adding a constant source of relatively weak supply of heat rather than a constant supply of extreme heat which is very hard to use whilst trying to keep a temperature of a substance being heated constant at a cool temperature in relation to the temperature of the flame.
* Not to damage the scales they must never be moved while turned 'on' and when moved pressure must never be applied to the balance.
Prediction:
Looking at the graph of the preliminary one can see that the rate of the reaction is steadily increasing as the concentration of the reactant varied is increased. Relying on the graph the following prediction can be made:
As the concentration of the reactant varied is increased the rate at which the reaction takes place is increased proportionally if all measurements are plotted on the graph as a scatter diagram then a positive correlation should appear. One can judge on how accurate the measures were and how fair the experiment was by judging on how strong the correlation is (the stronger the correlation the less anomalies there are).
As the temperature of the experiment is increased one should expect the results to appear in the same manner in relation to other measurements carried out under the same temperature as all other measurements. Although as the temperature under which the experiment is carried out is increased the amount of Carbon Dioxide gas given off should increase. This is due to particles of the reactants colliding at greater speed and therefore carrying more energy to break their bonds and form the Transition State in order to form the product.
So one can expect the rate of reaction of the experiment to speed up when the concentration of the reactants is increased and speed up further when the temperature under which the reaction is carried out to increase further.
Scientific explanation:
As we increase the number of particles that react, the number of useful collisions increases; we could therefore say that as the number of useful collisions increases the number of successful collisions increases. As we increase the temperature the collisions have higher energy to break their bonds, therefore the number of useful collisions that don't react decreases (a collision is useful when it collides with it's reactant).
Setting up the experiment:
. The marble chips have been cut previously 9 by 12cm, but as they may have been inaccurate they were further weighed. A mode mass has been selected, then larger chips were further cut in order to weigh the same amount as the mode mass. Smaller chips were thrown away because if they were to have been added to then the surface area of the smaller chips + their addition would dominate the regular chips on the basis of the reacting surface area and the experiment wouldn't be a fair one.
2. Hydrochloric acid (aq?) has been set up in order to be ready, so that when the water is heated no time is wasted by jarring liquids and then having to further delay the experiment by adjusting the temperature of the water.
3. A Bunsen burner has been set up with a tripod above it.
4. 900ml of water was placed in a trough on top of the tripod, this would be heated as the experiment goes on: after the measurements at room temperature (20?C) are carried out, the container would be heated 10?C to reach 30?C, after those results are collected the container would be further heated, etc.
5. The conical flask has been dipped into a water bath inside the water jar.
6. A measuring cylinder has been filled with water, a cork has been lightly placed into the cylinder to stop any water from flowing out whilst it is upside down. After it has been placed upside down into the water the cork was removed, and the cylinder was then supported so that it remains upright and no person has to hold it throughout the experiment.
7. A tube has been connected to the conical flask and led under the water and underneath the measuring cylinder, making the escaping bubbles go up straight into the measuring cylinder.
8. The hydrochloric acid was then poured into the conical flask and the marble chips followed, after which the flask was immediately shut using a cork especially for use with a conical flask of this type.
9. Straight after the cork was placed onto the conical flask the stopwatch has been started.
0. When the water has reached 10ml a measurement of how much time has passed was written down, another measurement was made on 20ml and so on, going up till 100ml by measurements of 10. However, when the water level reached the point at which the time had to be measured and written down, the time on the timer has not been stopped, instead a function that let's the user view the time at the exact moment of when the button has been pressed but keeps on counting the time that passes.
1. After the water level has reached 100ml, the final time is recorded into a table and then plotted onto a graph. (The first measurements are done at room temperature, 20?C)
2. Below is a table of results for the rate of reaction done at 20?C.
After plotting these results into a table, further measures have been made, they have been carried out at temperatures up to 70?. Here are the results in order of the temperature rising:
In try 3 the results are all anomalies therefore they have not been considered in the average.
Graph keys:
Standard Maths and calculations are done using the metric system; the metric system has 1, 2, 3, 4, 5, 6, 7, 8, 9, 10. After that the numbers go into another set of 10. Time however is varied, in days there are 24 hours, in an hour 60 minutes and in a minute 60 seconds, etc. In order to make a graph that will go by the time order, either the graph paper has to be altered, the graphs would have to be smaller because there are only 6 numbers instead of 10 or one would have to adapt the data to suit the graph paper. If neither were done then a perfect set of results that would normally fit perfectly onto its line of best fit would appear in steps. The numbers would go up to 6 and then jump straight to 10. The easiest and the quickest solution is to adapt the data for the graph paper.
Seeing that in the given experiment hours aren't used due to the experiments' speed minutes could be used in a metric system.
Explanation on how to interpret these graphs: Minutes are written normally, 10 cells per minute, however in a minute there aren't 10 or 100 seconds, there are 60. Therefore if one was to divide 100 by 60 then the answer given would be a number to time the seconds by in order to get a proportional graph. As mentioned earlier, minutes aren't alternated, only seconds are.
Graph analysis:
* As could be seen the graphs have a strong correlation, this implies that the data collected is reasonably precise and few anomalies have occurred.
* As seen on the graph "The comparisons of lines of best fit" the lines of best fit get steeper as the temperature is increased. This means that as the temperature is increased the reaction goes faster and it should increase further as the concentration of the solution is increased.
* It is also clear that as the reaction goes faster the measurements are more inline on the graph, this leads us to believe that the reaction is steadier and the gas is being given off at a more constant rate.
* Although the line of best fit on the graph that shows total times to fill 100ml of gas is straight it should be a curve. The reason for that is because a straight line would eventually end up at 0. This could be the case if one was to look at it in terms of reaction (at a certain temperature the reaction stops); but at the other end of the line is the time limit and if the line is straight then it would have to reach zero, which is an impossibility because however fast, reactions cannot take place in a time space of zero. However this is to be considered only when the temperatures have a higher range and amplitude than those used in the given experiment.
Evaluation:
* The results collected were sufficient to support a firm conclusion but the reliability of a small amount of the data was in doubt.
* At 30?C, trial 3 had to be ignored in the final average as an anomalous result. This could be due to experimental error. This could have been due to the temperature of the experiment being slightly higher than 30?C giving a faster result or due to the stopwatch being started slightly earlier than needed to.
* A large number of results were obtained, giving a broader view of the given reaction.
* The experiment was carried out by the plan and all the safety procedures with no accidents or misfortunes.
* One could have expected in the Overall time graph to have seen the temperatures to level off as more atoms and particles were used up during successful collisions. However, this change in rate of reaction as reaction proceeded was not apparent and the graphs showed straight lines for each temperature when the lines of best fit had been plotted. This is likely to be because of the relatively small amount (100mls) of CO2 collected which did not allow each reactant to be used up and all possible collisions to be completed.
* To improve the accuracy of the experiment, instead of leaving the acid for 5 minutes to warm up, what could have been done is the acid could have been warmed up for longer and had been measured to make sure that it is the right temperature before the reaction starts. This is likely to have provided more accurate results.
* The temperatures could have been given a wider scale by measuring the reaction in 10?C and also in 80?C.
* Having 5 tries instead of 3 could have evened up the average providing more precise data.
* Having more time the apparatus could have been changed in order to allow measuring the total amount of Carbon Dioxide gas given off, this would allow us to see the point at which the reaction rate got slower for each temperature. This was not possible due to 100ml measuring cylinders being used, which limited the experiments' potential.
By Paul Markov