To start with I had to come up with the sort of thing that I will be testing and the variable I had to change, which was length of wire. I choose to do this as I thought it would be easiest to do and would be easier to perform. After I had decided this I had to check all the equipment that I would be using and how I would use them when performing my actual results. Here is a diagram showing the apparatus I have chosen to use, this is not my circuit diagram:
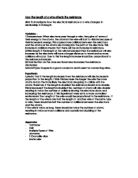
This is now a diagram showing what my actual circuit diagram will look like which I am testing in preliminary:
This is a diagram of the circuit that I will use in my experiment. During preliminary I will test if it all works well and if it does I will use this circuit for my real experiment. As you can see the voltmeter is connected in parallel with the wire board. This is because I need to work out the potential difference across the length of wire so that I can work out the resistance of the wire. The rest of the circuit is connected as a series circuit, as this means that the same current flows through each component and this needed to happen to make sure that it was a reliable experiment.
After I had an idea on the sort of circuit I would be using I had to test to see if it worked and that it would give me a good set of results. Firstly I had to test each piece of apparatus to see if it would be write for the experiment that I would be doing. I simply did this by creating a basic circuit and testing that all the equipment worked how it should. After I could see that the equipment was working well I decided to do a test run and get results that would fit with my prediction that as the length of the wire increases the resistance increases. My first test I decided to keep the current at 1.26 Amps. Immediately I could see that this would not be the most reliable choice for a good set of results. This is because at 1.26 Amps the voltage was moving around all over the place and we weren’t getting consistent results. It was the same for all the different lengths that we tested. I think this happened because there was lots of current flowing around the circuit and you couldn’t get an accurate result for the voltage across the wire. These were the results we got:
As you can see from the results I got extremely random results and at some lengths I wasn’t even getting results as it was always changing. After looking at this I decided that we had to change something to our method. So for are next test I decided to lower the current through the circuit by using the rheostat. I thought this would help because I imagined that the voltage would not move around because there is less current flowing through the circuit. I decided to drop the current to 0.04 Amps, and this worked well as I got a good set of results that were easy to perform. Here are the results:
As you can see from the results I have a lot better set of results that match my earlier prediction. I now have results to show that my method will be good to further these results, to allow them to get a more reliable conclusion. I used preliminary to test all the apparatus that I would be using and to do test runs to make sure that my method was reliable.
Method
Equipment
.Power supply
.Electrical wires to connect circuit (6 needed)
.Ammeter
.Voltmeter
.Rheostat
.Wire Board
.Ruler
1) Collect all the equipment- All the equipment that we decided to use we had tested in preliminary to see if they would work well. We had to evaluate each piece of equipment to make sure that it was write for our experiment as you cannot have equipment that may make the results you get wrong or unreliable.
2) Plug the power supply into electricity socket and attach one end of a wire into the power supply and another wire into the other available hole in the power supply- We use the power supply to give the whole electrical circuit power. However as we are only performing a small electrical circuit we need to only be using a small amount of power. We use the wires to connect the whole circuit, they’re essential as without them there wouldn’t be a full circuit which you would need for any power to go through.
3) With one wire attach the other end to a Rheostat and use another wire to attach the rheostat to the ammeter- We use the rheostat to control the current so we can keep the temperature the same and we obviously use the ammeter to see what the current is through the circuit.
4) Attach the two cables left to two of the holes in the wire board, you must measure the distance between them as that is the length of the wire you will be changing- This is where we will be using the ruler to measure all the different lengths that we need to get the results. You will be using all the holes to get all the different lengths.
Here are the measurements that we will be using to change the length of the wire:
10cm
20cm
30cm
40cm
50cm
60cm
At the moment you will have a series circuit with a rheostat, battery, ammeter and length of wire
5) Then you need to connect the voltmeter in parallel with the length of wire so you can see the potential difference across the different lengths of wire- This is why we use the voltmeter to measure the potential difference and it is how we get our results because we use the equation power/current= Resistance. You must make sure that the voltmeter is connected in the correct holes which mean it must be in the voltmeter holes.
6) After the whole circuit is set up you must see which measurement you are testing and use the rheostat to put the current at 0.04 amps- This why we use the rheostat, you can change the current by moving the rheostat up and down. It allows us to keep fair testing.
7) Then you need to record the result on the voltmeter, and then you have got one result
8) You repeat this for each different length and do each length three times
9) After you have all the results you use the magic triangle to work out resistance of each test. Here it is:
Results
Graphs
Interpreting Results
From the graphs and the results that I have got I can clearly see that there is a strong correlation that as the wire gets longer the resistance gets bigger. After performing my method I got the results and decided to draw some graphs so I could compare all the results that I got and compare figures.
The first graph that I drew I decided to compare the results I got from all three tests. From this graph I can clearly see that there is an upwards trail of all the three lines which shows me that as the length of the wire increases, the amount of resistance across the wire increases. I can also see from my graph that all three tests have a nearly identical trail which shows that I got results that were almost the same for all three tests. I can also see from the graph that all three lines follow the line of best fit; this tells me that I have extremely accurate results. I also put on the graph the correlation coefficient. I did this to measure how closely related each set of data is. From this I could see that there is a strong positive correlation between my results which is a good thing as it shows that my results are consistent and then allows my conclusion to be more reliable.
For my second graph I decided to draw a line graph with the mean of all three tests. Again it clearly shows that as the length of wire increases the resistance across the wire increases. I also can see from the error bars that I drew, that at all lengths we have a tight distribution of values. This shows me that I don’t have any outliers and that all values are basically the same. I can see this from my error bars because they are very small, which shows me the range of values for that length are near enough the same. Again you can see from my graph that the line from the mean value of the tests has a similar trail to the line of best fit. This again shows that we have no outliers and that the results are very consistent. I also on this graph put the correlation coefficient to measure how closely related the mean of the three results to the three results was. This again showed a positive correlation and again is more evidence that can boost the reliability of the conclusion.
Also after looking at my results I was starting to notice a pattern which gives more evidence to the reliability of the results. I can see that the results start at 1.75 and go up in two’s every time I increase the length of the wire by 10cm. This shows me that my results are not just similar but they follow the same pattern which gives me even more reason to believe the reliability of these results.
I think it is fair to say that from these two graphs that I have created the length of a wire affects the resistance through a wire. You can confidently say this as the reliability of the results is very strong.
Scientific Understanding
After looking at the graphs that I made I can clearly see that as the length of the wire gets bigger the resistance gets bigger as well. In any investigation for it to be approved by other people you must have a theory, evidence to back it up and then knowledge on why it happens. It is the same here were I need to show why this happened in my experiment. It is because in a longer wire there are more electrons colliding with metal ions as they travel along the wire because the wire is longer and there are more metal ions for the electrons to bump into each other. Resistance is a measurement of how much a material tries to stop electricity flowing through it. You can think of this as an army of people trying to get through another army and get to the other side, imagine how much harder it would be if the army they tried to get through got bigger and bigger and bigger. This is just a real life example of how the resistance will get bigger as the length of the wire increases.
You can also see from the graph that we have similar results, for each test. This is because we were able to control the variables. It shows that we had a good method and it is also backed up when we can see a pattern where the length goes up by 10 the resistance goes up by two. As we knew that if we don’t control the variables that must stay the same we would get strange results. This is because we know that the variables must stay the same because they change the resistance through the wire in different ways.
Evaluation
After performing my experiment I found I had very good results which showed some good evidence. On a whole as well I think it is fair to say that the experiment that we performed worked well. The apparatus that we decided to use worked well and was extremely reliable. In preliminary we did tests on all the apparatus to see if they would work well when we perform are actual experiment. I feel that the apparatus we used worked extremely well, this is because we were able to use them very easily and were able to get a good set of results. I found the wire board an extremely handy piece of equipment. I say this because it helped me get a good set of results and it was easy to use. As it already had the wires with the rounded lengths on them it made the experiment run a lot better and was easy to get a quick set of results because I could easily change the lengths around. It also allowed the results to become a lot more accurate as I knew I had the exact lengths of the wire so when I compare the lengths of the wire I know that they are accurate which improves the reliability of results. I also feel that the rheostat worked well because it helped me get a fair set of results. I felt the rheostat worked well as it was a quick and sufficient way to keeping the current the same. Again helps the accuracy of the results as I know that I am keeping the current the same which allows me to perform a fair test.
I also feel that the ammeter and voltmeter were easy to use and were key to the experiment. I used the ammeter and voltmeter to work out the resistance through the wire. However when using the ammeter and voltmeter you must be careful that you put the wires into the correct holes of the meters, otherwise you will get funny results which happened to me when I first started the experiment. If I was to do the experiment again I would make sure that I paid closer attention to the meters to make sure that they were all correct before I started the experiment to avoid any dodgy results. However I must say that the reliability of the meters is very strong as I got a good set of results from them.
I feel that the method worked well and it showed when I got a good set of results. When performing my method it was easy and it didn’t take long to get a set of results three times round. However if I was to do the method again I would make sure that before I started taking measurements of the voltage at different lengths that I would measure the different lengths out before, I don’t think this would drastically change the results that I got but it would make it easier and less confusing because then I wouldn’t have to measure each length that I am doing before each experiment and it would help me to perform the experiment quicker. Other than this I thought the method worked really well.
Looking at the results I have shows real evidence that as the length of the wire gets longer the resistance is going to get bigger. I can also see that the reliability of these results is extremely strong. I say this because for each length I took three results, I did this to make my results more reliable and to make the evidence even stronger. I can also see from taking three results that I don’t have any outliers and that all my results are near enough the same. An outlier is a result that is extremely different from the other results you have for that length. However I can’t see any of them in my results.
Another reason why I feel that my results are extremely reliable is that we can see a pattern in them. This shows that there is a link and is showing consistency in the experiment. It also shows that they aren’t random results that are all over the place. If we had more time I think it would be interesting to see if we could test more lengths and the pattern continued. This would make my results even stronger and even more reliable. So overall I feel that my results are extremely reliable because I have taken three results that are similar, I have scientific knowledge to back them up and you cans see a pattern in the results that show consistency.
I feel that if we had more time it would be a good idea to get more results. I think it would be good to get lengths all the way up to 100cm. It would be interesting to see if the line on the curve continued upwards and that the pattern continued.
Conclusion
From our results we can see that as the length of wire increases the resistance gets bigger. This is my final conclusion that I made after I evaluated how my investigation went, I feel like this is a fair conclusion after we have graphs that prove it and we have performed repeated tests to check if they are correct. I feel the investigation went well and we have finished with some positive results.