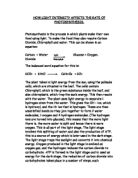
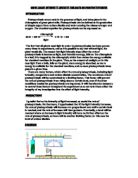
There are many factors, which affect the rate of photosynthesis, including light intensity, temperature and carbon dioxide concentration. The maximum rate of photosynthesis will be constrained by a limiting factor. This factor will prevent the rate of photosynthesis from increasing above a certain level, even if the other conditions needed for photosynthesis are enhanced. It will therefore be essential to control these factors all through the experiment so as not to let them affect the honesty of my investigation into the effect of light intensity.
Planning
The aim of my experiment was to conclude whether intensity of light would affect the rate of photosynthesis in a plant. To do this, I placed a piece of pondweed (ecklodia) in varying light intensities, and observed the quantity of oxygen being given off. I used Canadian pondweed because of its unusual quality of giving off bubbles of gas from a cut end, when placed in water.
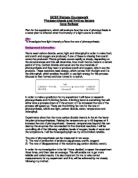
I predicted that as the intensity of light amplified, so would the rate of photosynthesis. Furthermore, I hypothesized that if the light intensity increases, the rate of photosynthesis will increase at a proportional rate until a certain level is reached, and the rate of increase will then go down. Eventually, a level will be reached where an increase in light intensity will have no further effect on the rate of photosynthesis, as there will be another limiting factor, in this case probably temperature.
The apparatus I shall use are as follows:
1 x 100cm ruler
1 x 50 watt light bulb (source of light)
1 x measuring flask (filled with tap water)
1 x piece of pondweed (eklodea)
1 x stopwatch
1 x pen and paper (to record results)
The method I use is as follows:
- Pour water into the flask to about ¾ of the total.
- Place the light source 50cm away from the pond weed.
- Measure this accurately by using the 100cm ruler.
- Start the stop watch as you turn the light source on.
- Count the amount of oxygen bubbles being released from the pond weed during the time period of 1 minute and record your results.
- Move the light source 10 cm closer
- Begin counting the amount of bubbles again through a time span of 1 minute and record your results
- Move the light source 10 cm closer Begin counting the amount of bubbles again through a time span of 1 minute and record your results
- Continue this pattern till the light source is 0cm away from the light source but so record the amount of bubbles released from the pond weed after 1 minute whilst the pond weed is 0cm away.
- Record the final results.
- Present the results in graph form.
Obtaining
I obtained the results in table form because I felt it best fitted the investigation.
Analyzing and considering evidence
The graph I used was a line graph I chose to use this type of graph because I feel it shows my results clearly. The graph shows no a mediate pattern but it does show a rise and fall in the rate of photosynthesis. I predicted a the rise in the amount of bubbles being given would increase as the light became more intense but at when the light source moved to 20cm away from the pond weed the rate of photosynthesis begun to decrease. This may have occurred for many reasons one being: as the temperature approaches 45oc the enzymes controlling photosynthesis start to denature thus causing the rate of photosynthesis to decrease and it may even cause it to stop all together. Another reason it may have reduced is: the pond weed photosynthesized to a point where it made enough glucose and no longer needed to photosynthesis (saturation).
Evaluation
This experiment was not in itself in my opinion accurate enough to show how light affects the rate of photosynthesis. This lack of accuracy was mainly due to the fact that by simply counting the bubbles, I was relying on each bubble being exactly the same size, which they clearly were not. Ways of improving this experiment are limited I could have made more results by moving the light source 5cm closer each minute of prolonging the minute to 2 minutes to get more precise and accurate readings. Another factor that may have caused inaccurate readings was the light already coming in through the classroom windows I suggest next time placing blinds over the windows preventing any foreign light affecting the experiment.
I do believe this test was fair as the only factor I changed was the range of the light source. I kept the light source the same, the pond weed the same, the water the same and the ruler the same.
From this investigation I have learnt that plants are more complex then I first imagined, before this investigation I never took into consideration the plants we see all around us each day where making their own food constantly from now on I will see plants in an entirely different prospect.