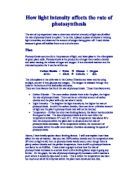
Above, I have briefly spoken about limiting factors. I will now explain how these affect the rate of reaction. Say you had 100% carbon dioxide and the temperature was 30˚c but no light at all, then no photosynthesis would occur; even though there is plenty carbon dioxide and the perfect temperature, there is still no photosynthesis as one factor is not fulfilled. I have drawn a graph to show how the rate of photosynthesis increases to a certain level until a limiting factor stops it going any further. On the graph, the rate of photosynthesis gently increases until it reaches a point where it suddenly dips down to zero. This is where the temperature has risen too much and all of the enzymes within the plant have denatured and died.
The equipment we used on this experiment were as follows:
- Boiling tube
- Beaker
- Thermometer
- Scales for weighing amount of Potassium Hydrogen Carbonate
- Potassium Hydrogen Carbonate
- Elodea
- Desk Lamp
- 100cm Ruler
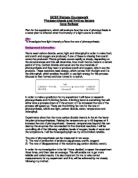
We picked a piece of elodea, and cut off the stem at an angle. This helps the elodea release CO2 bubbles from the stem and it is easier to count the bubbles. This was then placed in a boiling tube, which was filled with water. 0.43g of Potassium Hydrogen Carbonate (KHCO3) was then dissolved in this water. This was added so the elodea would bubble CO2 from its stem. The boiling tube was then placed in a beaker of water for insulation. This was because the heat from the lamp would raise the temperature of the elodea and speed up the rate of photosynthesis, which would render the investigation useless. The thermometer was then placed in the boiling tube and the temperature was measured and recorded. The lamp was then placed a distance away from the elodea and was turned on. We counted the amount of bubbles appearing from the cut stem of the elodea within a minute. The lamp was then brought closer and another minute was given and all bubbles were recorded. There were 5 measurements in total. These were: 5cm, 10cm, 15cm, 20cm, and 25cm.
Our results were made accurate by doing each test three times; therefore, taking an average of all three. They cannot be perfectly accurate because of room-light and heat change and maybe by miscounting some bubbles.
To make this a fair test I will make all the above precautions and make sure that all measurements are recorded with accuracy and care. The amount of CO2 would be hard to measure because we do not know how much is actually being released per bubble. It may be a big bubble and still be counted as “1” bubble. It will be difficult to control how much light the elodea is getting. In the room in which we did these tests, the main lights were on and so that may change our results to a higher rate of photosynthesis. But as all 5 measurements were carried out in the same room under the same conditions, the results should be quite fair.
Seconday Data Source
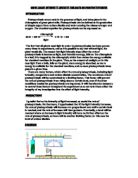
These are results from a Longmans Co-ordinated Biology Book (T. Parkin & J. Simpkins 19..) class results from a study on the effects of light on photosynthesis, but no KHCO3 was used:
As you can see form these results, the closer the lamp to the elodea, the more bubbles were formed. Therefore a higher photosynthesis rate must be occurring due to the increase in light intensity. From this and other previous knowledge, I can make a educated prediction.
Prediction
I predict that the nearer the lamp is to the elodea, the higher the rate of photosynthesis. The Longmans Co-ordinated Biology Book also has results which match my prediction. The higher the rate of photosynthesis, the more bubbles will appear from the stem of the elodea. I think this will happen because the brighter the light intensity, the faster the rate.
Obtaining Evidence
Table
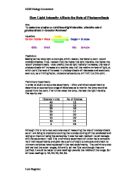
These results were very accurate and good. The temperature of the water rose by only 1˚c so it did not change or disrupt our results. We did not change the water or elodea throughout this whole test to make it fair.
Light Intensity
I can work out the light intensity for each measurement with this equation:
1
(Distance of lamp from elodea)2 x100
For 5cm, the light intensity was (1 over 52) x 100, which is 1 over 2,500.
For 10cm, the light intensity was (1 over 102) x 100, which is 1 over 10,000
For 15cm, the light intensity was (1 over 152) x 100, which is 1 over 22,500
For 20cm, the light intensity was (1 over 202) x 100, which is 1 over 40,000
For 25cm, the light intensity was (1 over 252) x 100, which is 1 over 62,500
When the lamp is moved further away from the elodea, the light intensity decreases and this equation shows that exactly.
Analyzing the Evidence
As you can see from the graph on the next page, the line of best fit is a nice line. I found that the fastest rate of photosynthesis was when the lamp was closest to the elodea at 5cm. The graph is negative which means that the lower the number on the x axis, the higher the answer on the y axis. The slowest rate of photosynthesis was when the lamp was 25cm away from the elodea. This all shows that the rate of photosynthesis increases when light intensity increases.
My results matched my prediction and secondary data source. I am happy with the results that we gathered for this investigation.
Evaluation
My results were accurate enough to make a firm conclusion. This was because I had completed 3 tests for each measurement and taken an average. There are slight things which may have changed the results but these are only minor problems:
-
The size of the bubbles – these could vary between big and small and no matter what size they were, they were still counted as “one bubble!”. To get over this problem, you would have to use a syringe to take in all the CO2 and measure the volume in cm³.
- The light in the room – could have sped up the rate of photosynthesis and made our results slightly faulty. To overcome this problem, the experiment should have no background light, just a desk lamp.
- Miscounting bubbles – due to human error. This could be overcome by using a syringe to take in all the bubbles, or use a computer to count the bubbles.
These could all be changed and improved to make the perfect environment to complete this test in.
The results we gathered were that of a fair test. All our recorded measurements came from a single piece of elodea. This test all ran smoothly and there were no unexpected results and no mistakes were made during the test.