Aim: To investigate the effect of varying concentration of a certain sugar solution on the amount of osmotic activity between the solution and a potato chip of a given size.
Factors and fair test: If I am going to make this a fair test, then I will have to control these other factors like I mentioned below:
The main factors which will need to be considered whilst doing the experiment are:
- Temperature of water: Doing the tests at one fixed temperature will control the temperature of the water. For the purpose of my experiment I am going to do all the experiments at room temperature.
- Size of chip: The size of the potato is very important. This is because if the size of the potato varies, so will the amount of mass it can loose or gain. I am going to try to cut all the pieces of potatoes, to the same size. Because of the ‘chipper´ I will have chips with the same weight at 3g, but the chip will be 3cm.
- Light: The light intensity will be mostly constant as the chips will not be moved whilst being stored.
- Mass of potato: The mass of the potato is a variable, and this means that it will be measured throughout the experiment. I will measure the mass in grams. The potato chip will be measured before it is put in the solution, and after. This will allow us to see whether osmosis has taken place, and how much osmosis has occurred.
- Volume of solution potato is: The volume of the solution that the potato chips are kept in must be the same. The chip must be totally covered in the solution, and the amount of solution will be kept the same because all the chips are the same size. The amount of solution I cover each chip in will be 30ml.
- Type of potato: The type of potatoes I will use is going to be kept the same, because different potatoes may absorb at different rates. For this experiment I am going to use the same potato.
- Time left in solution; the time the potato chip is left in the solution must be kept the same for each chip. This is because more or less solution may be absorbed depending on time. I am going to keep each potato chip in each solution for 24hours.
- Surface area of potato chip: The surface area of the potato chips will be kept the same by having all the chips the same size. This must be kept the same because the amount of surface area exposed to the solution may affect the rate of osmosis. The thickness of the chip will already be the same, so I will cut the length of each chip to 3cm long.
- Using the same balance to measure chip: To make the mass readings fairer, I will take each chip, roll the chip gently on a paper towel, to remove all excess solution, and I must not squeeze the chip. I am also going to use the same balance to weigh my chips. This is because the measurements may vary slightly between scales.
Hypothesis: Osmosis is defined as the net movement of water or any other solution’s molecules from a region in which they are highly concentrated to a region in which they are less concentrated. This movement must take place across a partially permeable membrane such as a cell wall, which lets smaller molecules such as water through but does not allow bigger molecules to pass through. The molecules will continue to diffuse until the area in which the molecules are found reaches a state of equilibrium, meaning that the molecules are randomly distributed throughout an object, with no area having a higher or lower concentration than any other. For this particular investigation I think that the lower the concentration of the sugar solution in the test tube the larger the mass of the potato will be. This is because the water molecules pass from a high concentration, i.e. in the water itself, to a low concentration, i.e. in the potato chip.
Therefore, the chips in higher water concentrations will have a larger mass than in higher sugar concentrations. I predict that the higher the concentration of sugar in the solution, the more water will move out of the potato chip. Therefore the distilled water solution will has the greatest mass and the higher the concentration that the chip is exposed to, the more water will move out of the chip; making it flaccid so the 10% chip will become flaccid.
Apparatus:
- Distilled Water
- 30 ml Sugar Solution at 2%, 4%, 6%, 8% and 10%
- 12 test tubes
- Cling Film
- Potato
- Top Pan Balance
- Beakers
- Knife
- Ruler
- Labels
- Paper Towels
- Measuring Cylinder
Method: in order to do the following experiment I will be following this procedure:
- Collect all the apparatus.
- I will carefully slice twelve bits of potatoes at the measurement of 3cm and weigh them at 3grams on the top pan balance.
- I will label all the test tubes so the solutions don’t get mixed up.
- Using a measuring cylinder I will pour all the concentrations at 30ml in the correct tubes.
- After placing the potato in the tubes I will cover them with cling film and leave them for 24hours.
- 24hours later I will remove all the cling film and dry the potatoes with a paper towel.
- I will then measure all the potatoes and record the results in a table.
The experiment must be repeated twice: the experiment may look like this:
Preliminary Work: Prior to this experiment I did an experiment to help with a prediction and also to help indicate a number and range for the main experiment. The results from this experiment had many errors occur due to humanly errors. Whilst doing the experiment we didn’t dry the top pan balance before we measured the chips and we also forgot to dry the potato chips. This caused all are results to be inaccurate also we decided to vary our solutions more. When we did out preliminary experiment we only used 2%, 8%, 10% and distilled water. This didn’t give us a good range of results and caused the whole experiment to weaken.
We also tried different masses for the potato chips and came to the conclusion three grams would be adequate. From the preliminary experiments we decided to vary the solutions more so we could monitor the way osmosis works clearer. So in our real experiment we decided on 3grams for the potato chips and try the 4% and 6% solutions as well. We also learn in the real experiment it’s necessary to dry the potato chip before measuring. The results below show the preliminary results as you can see they are inaccurate. Doing this preliminary experiment helped us improve our real experiment greatly.
Obtaining your evidence: Whilst we were doing the experiment I was fortunate as I was able to follow the method.
Experiment two:
I used the formula: change in mass
Mass before X 100
Considering results:
Conclusion: I have decided to draw both graphs for the results and make a decision when I see the result of both. The graph which looks more accurate is the one I will analyse. Drawing both graphs I have come to the conclusion that the second experiment is more accurate as there seems to be less errors then the first experiment by far. In the first experiment the gradient isn’t steep as it should be.
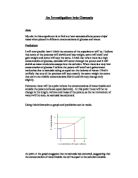
The graph shows what was obtained when the concentration of the solution is plotted against the percentage change in mass. At point D the graph tells the viewer that no osmosis has occurred, suggesting that the concentration of water inside the cell is equal to the solution outside. At point A and B (high water concentration), there is indication that the cell is increasing further in size. This is because the cell is fully turgid and no more water can enter. At point E and F (high water concentrations), there is indication that the cell is decreasing further in size. This is because the cell is going through osmosis.
However, there is a pattern on my graph, and this is as the concentration of the solution increases, the percentage change in mass decreases. The graph shows that the percentage gains and loss in inversely proportional to the concentration. The gradient does change in my graph. It gets less steep as X axis gets bigger. This is because the potato chip is becoming as flaccid as it possibly can, and so the change in mass of each molar concentration is becoming closer and closer together.
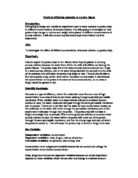
It shows that the potato cells increase in mass in solutions with a high water concentration and decrease in mass in solutions with a low water concentration. When the concentration reaches above 10%, there appears to be no further water loss, suggesting that the cell is fully plasmolysed. From the graph an estimate to the concentration of the potato cell can be made at 6% as this is the point where the potato is not increasing or decreasing in mass, this is known as the isotonic point. This is where no osmosis is taking place; both the potato and the solution have an identical molar concentration. The next point E looses approximately 0.333%. This shows that the water potential of the sugar solution in the beaker is weaker than that of the potato chip. The next, 10%, looses approximately 0.33% in mass. This shows that the sugar solution has a weak water potential and that osmosis took place. This is why the potato lost even more mass, and it shows that the water potential in the beaker is less than that of the potato chip. This pattern carries would carry on through the graph if there was more range of Molars, and even more mass is lost, as more water moves out of the potato into the solution.
This graph of the change in mass helps prove the point of complete plasmolysis, whereby the potato cannot expand and take in any more water. As you can see as the molar concentration increases the change in mass decreases. From right to left the first two points on the graph are very spread out indicating that there was a large change in the mass. This decreases throughout the increasing molar concentration until the change is minuscule.
This graph shows a clear indication that there was an overall increase in mass during the experiment. At point D the percentage increase and decrease is separated.
My results also match with my initial predictions.
Evaluation: There were not many out of the ordinary results in the second experiment, but some were not as close to the line as others. There was anomaly which was circled in the graph and didn’t fit in with the pattern. This may have been caused by human errors. When the potato chips were removed from the test tubes and dried I may well have dried some potatoes more thoroughly than others and so some would have more excess water, which would add to the mass. If the experiment was repeated I could find another way to dry the potatoes that would ensure that all were dried in the same way for the same time. However with all this said I think that the experiment was successful and I was very pleased with the complete comparison of my results with my initial prediction.
However I do believe the first experiment went awfully wrong as the results were all inaccurate as they didn’t follow the pattern of osmosis. This could have been to a number of factors such as the surface area also there may have been an error with the molar concentrations.
The cutting of the potatoes was the most difficult part of the experiment as although I was recording my results by mass, it could well have affected the surface area and so the overall rate of osmosis. If I were to repeat the experiment I would have possibly found a machine to cut the potato as it would ensure that all potatoes would be the same in weight and dimensions. As well as the potato I could have found a more accurate way to measure out the solutions and to determine the molar concentrations. Perhaps I could have used a burette. This would ensure that I have an accurate amount of fluid in each test tube. I could also weigh each chip on a more accurate scale, e.g. not to 0.00g but to 0.0000g.
The accuracy of the experiment was accurate to suit our purpose to make it more accurate several steps could have been taken.
1: Human error: Human error could have been reduced by taken more accurate measurements to a uniform result. This could be attempted by using a tool which could be set to a set length to cut the potato.
2: If the potatoes did not rest against the sides then they would all have the same amount of surface area. This is the same for the potato samples that float therefore exposing them to air and the samples that sink stopping osmosis occurring on the areas that are touching the bottom of the test tube.
Reliability: The results were reliable to take a reasonably accurate result. However the steps above (1, and 2) would produce an even more accurate result.
Further work: To extend this experiment it could be repeated exactly as before. However this time results at the morality levels. This would produce much more accurate results.
Other variables in the experiment could be changed for example instead of changing the weight of the potato the species of the potato could be changed. For example new potatoes, King Edwards etc could be used. Also the shape and size could be changed. However this would not affect the results much. This is because the variable would only change the rate of osmosis because of a different weight and size.
Temperature could also be changed for example the samples could be placed in different water baths and brought up to different temperatures to see if temperature played its part in the osmosis of potatoes. 5 sets of 5 potatoes could be placed in water baths at 10oC, 20oC, 30 oC, 50 oC and 60 oC. Then leave them for 24 hours making sure all the variables in the first experiment still apply however just using one molar solution. Then after 24 hours re-weigh the samples and record the result. I would expect that at high temperatures the potato samples would osmosise the most. This is because at high temperatures the solutions water molecules would move faster and therefore equal the concentration faster. A preliminary experiment could be set up beforehand to find out how long the experiment should be kept going because if the concentration of the potatoes equalises then the weight of the potatoes will be almost exactly the same.
I could extend my coursework by testing the same brand of chip using a different substance. By this I mean using a different thing instead of sugar, i.e. salt or coffee or even vimto. Then I could find out whether osmosis occurs differently with different things diluted in the water. I could even use different vegetables.