Method
First a length of wire over a metre long is sellotaped to a metre rule. The positive crocodile clip is attached at 0cm. And the negative is moved up and down the wire, stopping at 20, 40, 60, 80 and 100cm. Each time (2 repeats) reading the ammeter and voltmeter to work out resistance R = V/I. This is using 30 SWG wire. Other variables, voltage, thickness, and temperature will be kept constant, although the temperature will rise once current is passing through it, which will cause the atoms in the wire to vibrate, and so obstruct the flow of electrons, so the resistance will increase, creating an error. In the experiment constantan wire is used because it does not heat up as much as copper, so the resistance is not affected as much.
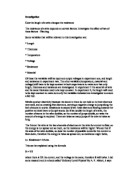
Results
Length (cm) V1 (volts) V2 (volts) A1 (amps) A2 (amps) Average resistance (Ohms)
100 1.00 1.00 0.20 0.20 5.00
80 1.00 1.00 0.30 0.28 4.00
60 0.90 0.90 0.40 0.30 2.80
40 0.90 0.85 0.50 0.40 1.94
20 0.70 0.80 0.80 0.75 0.94
Analysis
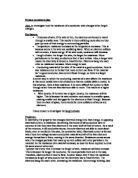
The graph of experiment 1 is a straight line through the origin, which means resistance is directly proportional to length. This means that if the length is 40cm, and resistance is 2, then if length is doubled to 80cm, resistance also doubles to 4.
This is because of the scientific idea, stated in the planning that if you double length, you double the number of atoms in it, so doubling the number of electron 'jumps', which causes resistance: The results support my predictions well, the results turned out the way I had expected, and they match the predicted line well. I had predicted a straight line through the origin, which means resistance, is directly proportional to length.
Evaluation
Evaluation Experiment one: This experiment was quite accurate, as when it is compared to the manufactures line which is on the same graph, we can see that this line is at most only 0.4amps, different form the manufactures line. This is a percentage difference of approximately 8%. This shows that the results were good, as 8% is a very small margin of error. The error bars on the graph show that the most inaccurate result was the 60cm result. This could be down to an error in the measurement of the wire or a temperature rise. The two results for 100cm are exactly the same, and it is near to the manufacture's line, so this is the most accurate point.
The other three readings have almost the same inaccuracy, an average of 10%, which again, is fairly accurate. The inaccuracy could have been because of the wire coming from a different manufacturer to the predicted results, as there is some discrepancy between the amount of copper and nickel in different brand's wire. The ammeters and voltmeters could have been damaged and reading falsely on both the meters used.
Measuring the lengths of the wire is also an inaccuracy as the rulers used are not exact, and it is difficult to get an accurate reading of length by eye, as the wire might not be completely straight, it may be of different density throughout the length. These would have contributed as well to the error. These results would be difficult to improve on as they are reasonably accurate, and there were no anomalous results. But if I were to do this experiment again, I would use newer, more accurate ammeters and voltmeters, a more accurate method of measurement, and take a much wider range of readings, and more readings so that a more accurate average can be taken.
I would also investigate other factors and see how these affect the resistance. I would also do the experiments under different conditions such as temperature and pressure to see if it makes any difference to resistance. As these results had a range of only 5 readings, from 0-100cm, and were only repeated twice, and that the results are not 100%, accurate due to the errors discussed earlier, then I would say that these results are not strong enough to base a firm conclusion on because there are so many sources of error, which are explained earlier. I would experiment with different lengths and types of wire.
John Hutton-Cornish