I know that the mass and the stopping distance or displacement are directly proportion because of the information above.
S = m x v2
2xF
The bracketed part of this equation is a constant. This is why I can say s is directly proportional to the m.
Using this piece of information I predict that the best fit lone on a stopping distance against mass graph will look like this:
The scientific information I used to create the basis of the above prediction came from the page above.
Preliminary Work
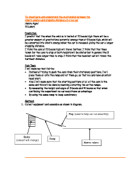
A preliminary experiment was carried out in order to find the weight to be used as the Braking Force. The apparatus was setup as shown below on the next page.
The Apparatus:
- Weights (1N each)
- Pulley
- Trolley
- Stool
- String
- Boards
- Balance
The weight was altered and the result between where the string tightened and where the trolley stopped was recorded as the stopping distance the weight was recorded as the Braking Force. The trolley’s mass was changed by adding different numbers of slabs on the top. I will try the maximum number of slabs (5) and the minimum number (0) to see if I can get a range of results.
The braking force (weight) will be 6N because the distances were measurable.
Fair Test
Before I create the method I shall find what factors may affect the experiment, which is the most significant of those and how I will control them.
The mass is the variable and so it will change. This will cause the velocity to change because the GPE is greater for a greater mass and will give and greater KE, which in turn will increase velocity. The GPE is affecting the velocity of the trolley because there is a slanted board. The slanted board is there so that we do not need to push it, which we would be inaccurate. This changing in GPE, velocity and mass is solved by the following equation:
- The energy lost to heat from friction will be minuscule so it will not be taken to account also it would be hard to measure.
It can be assumed that all the GPE is transferred to KE.
GPE (Gravitational Potential Energy) → KE (Kinetic Energy)
GPE = KE
m x g x h = ½ x m x v2
m x g x h = ½ x m x v2
Therefore the mass of the trolley will not affect the GPE whereas the height of the ramp will. I will therefore keep the height the same.
- I should keep the trolley the same as its mass may vary. Therefore the mass of the trolley will be consistent throughout the experiment. The mass is going to be the variable in this experiment and will be altered by adding pre-weighed slabs.
- The board must be kept perfectly flat in order that no energy is wasted on a bump. The same boards must be used since the friction between the trolley and the boards may vary. If the friction changes, the results will be invalid because the greater the force of friction, the shorter the stopping distance will be.
- The slanted board must be kept on the same angle. If there was a greater angle/height, there would be a greater GPE and so an unfair and invalid result would be obtained.
- The braking force must be the same. The amount of force that will be used was calculated in the preliminary experiment.
Diagram
The apparatus will be setup as shown above.
The mass on the trolley will be varied from 0 – 5 (the mass of each slab will be measured on a balance).
The braking force will be kept constant at 6N.
The trolley will be released from the top of the first board.
The distances will be recorded between where the thread tightens and where the trolley stops.
I will record the stopping distance by setting the length of the string so that it will tighten when the trolley reaches the flat board. I will draw a line where it stops and measure the distance with a metre ruler.
I will take 5 recordings. The first with no mass on the trolley and then with 1 then 2 then 3 then 4, and finally 5 masses.
I will repeat each mass 3 times to increase the reliability and to try to ensure that there are no anomalous results.
The precautions I need to take are listed in the fair test section.
Safety
I will keep away from the weight so that it does not drop on my foot and place bags at the end of the board to stop the trolley if it goes off, which it should not according to my preliminary results.
Obtaining the Evidence
The results I shall take will be the following:
- The mass of each of the 5 slabs.
- The mass of the trolley.
- I shall calculate the mass of the trolley and the specific number of slabs to be put on it.
- I shall perform each experiment three times to check for reliability.
- I shall measure the stopping distance each time.
- Then I shall calculate the averages.
The only change I made to the actual method was that the pulleys were connected under the stool rather than above it.
The figures below show the masses of each of the five slabs that were used to add mass to the trolley.
1 – 776g
2 – 774g
3 – 775g
4 – 771g
5 – 772g
The Trolley’s mass was 844g
The table below shows the results of the experiment using 6N, which includes the apparatus which is 1N plus the 5 masses of 5N.
1 2 3
Averages
Average results will be put into a graph so the relationship between an increase in mass and stopping distance can be observed.
I did not push the trolley or give it extra force; I just allowed it to move under the force of gravity. This ensured the results would be accurate and fair.
I made sure that as I released the trolley that it would move in a straight line and therefore not move off the board.
Analysis and Conclusion
From my results I can see that as the mass increases the stopping distance does too. I found the relationship between the mass and stopping distance is directly proportional.
This is because as the mass increases the GPE increases when placed on the ramp. As the trolley moves down the ramp the GPE is converted to KE. Therefore the greater the mass the greater KE the trolley will have. For the trolley to stop, there must be an equal and opposite force to the movement. Therefore a trolley with greater kinetic energy will need a greater braking force to oppose the movement.
As the braking force is the same throughout each experiment the increase in energy has transferred lost by another means before the trolley will stop. This is why the trolley has a longer stopping distance when there is a greater mass.
S = m x v2
2xF
The above equation is Stopping Distance (S) is equal to mass multiplied to the velocity squared over force multiplied by two.
The bracketed part is a constant. Therefore the stopping distance and the mass are directly proportional to one another. The graph shows this, as it is a straight line. Therefore I can say that the above equation is correct.
Though in my prediction, I stated and drew a predicted graph showing the line going through the origin, this was not so in my graph results as it went through at about 20cm on the y axis (stopping distance).
I can find a substitute the mass, v2, and the force to get a theoretical stopping distance and I could compare this with my actual results.
Mass:
Force: 6N (braking force)
v2: I could find the velocity squared by using the formula: GPE = KE,
h x g x m = ½ x m x v2
Now I will substitute the mass and height: 0.20m x 10 x 0.844 = 0.5 x m x v2
= 1.688 = ½ x m x v2
v2 = (1.688 / 0.5) / 0.844
v2 = 4
Since v2 is a constant, I do not need to figure the velocity squared for every mass. 0
2xF
Theoretical stopping distance = mass x v2
2xF
= m x 4 / (2 x F)
= m x 4 / (2 x 6)
= m x 4 / 12
= m x 0.33
= 0.844 x 0.42
S = 0.28133…m
= 28cm
I can replace the mass for each trolley mass and therefore create Theoretical Stopping Distances (TSD). I will create a table containing the masses the TSD and the Average Stopping Distance (ASD).
I can round the above figures of the TSD to:
28cm
54cm
80cm
106cm
131cm
157cm.
I can now draw another line onto my graph, which holds my actual results too.
Evaluation
I think the method was a good way of carrying out the investigation. If it was done correctly and without mistakes it could be very successful. But there are things that could alter the results and make them inaccurate, which is listed below.
From my graph I can see that all my results fit the best-fit line well. But since the results I used were averages any anomalous results were hidden. I had an anomalous result of the trolley mass of 3940g on the third experiment. The distance was 135cm, which was 6 – 7 cm different from the first two experiments. The mass of 3169g was a slight anomaly, all of them touched the line in some way except for this.
I would think that the reason that this result may be inaccurate is because:
- The movement not in a straight line.
- The speed may have changed.
- Method/Measurements (human) Errors.
To solve the above problems I would:
- Create a rail track to keep the movement straight. Barriers would not work because if the trolley made contact and extra large amount of friction will be added and make a large change to the results. The friction on the rail track would be larger than that on a normal board but it would help the accuracy.
- The speed change is unstoppable therefore all I could do is monitor is. I could measure this by attaching the end of the trolley to a strip of paper in a ticker tape machine.
- All I could do to stop making any method or measurement errors is to be more careful
As you can see on the graph, the TSD line of best fit and the ASD line of best fit are very similar. In one case a point ASD passes through the line of best fit of the TSD. The two lines cross at this point. The difference in the two lines could be because of small uncontrollable things such as energy lost through heat from friction, inaccurate measuring and uneven surfaces.
Also only the theoretical line passes through the origin, not the real line. According to my graph (ASD line) that at a mass of 0g the stopping distance is 8cm, which is clearly impossible.
My graph, ASD line, look very similar to the simple predicted graph, except for it not passing through the origin. But the theoretical line is almost identical.
I think my results support the conclusion I have made very well.
Improvement/Extensions
However I could try it with:
More slabs upon the trolley,
Different heights to change the amount GPE transferred to KE for movement,
Different surfaces to see how friction changes stopping distance,
And more accurate apparatus to check that the patterns shown in this experiment are correct and generally to make the experiment more accurate.
Further work could be done to this experiment like using light gates to measure the velocity of the trolley as it passes down the ramp. The light gate would be placed and different points and it could measure the time taken to pass them. Then the stopping distance measured and the time taken could be used to get the velocity = distance/time. Using this I could find the acceleration using the formula:
Acceleration = change of velocity
time taken for change.
E.g. Acceleration = (50-20) m/s = 6m/s2
5s
Using this I could use the formula, Force = Mass x Acceleration, and find the force.