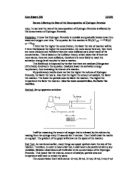
Method: Set up apparatus as below:
I will be measuring the amount of oxygen that is released by the solution by reading from the syringe every 15 seconds for 5 minutes. Then I shall draw the results on a graph. The gradient of the graph will show me the speed of the reaction.
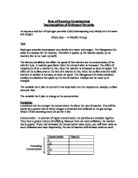
Fair Test: As mentioned earlier, many things can speed up/slow down the rate of this reaction. Therefore, in order to have a fair test, I shall have to be careful of all my key variables. Between observations all I will alter is the concentration of the Hydrogen Peroxide. This means that the volume, amount of catalyst, particle area and temperature will have to remain the same.
The concentration that I will use are: 25 vol, 20 vol, 15 vol, 10 vol, 5 vol, 0 vol
Safety Precautions: As Hydrogen Peroxide is very corrosive I shall be very careful around it. I will always wear safety goggles. I won’t tip the Hydrogen Peroxide down the sink.
In order to keep my results reliable, I shall repeat the experiment several times, and take the average.
Results:
Concentration of Hydrogen Peroxide: 1M
Concentration of Hydrogen Peroxide: 0.83M
Concentration of Hydrogen Peroxide: 0.67M
Concentration of Hydrogen Peroxide: 0.5M
Concentration of Hydrogen Peroxide: 0.33M
Concentration of Hydrogen Peroxide: 0.17M
Conclusion: From looking at my graph I can see that I have succeeded in my aim. My original aim was to see how the rate of the decomposition of Hydrogen Peroxide is affected by the concentration of Hydrogen Peroxide. Now, as can be seen quite clearly from the graph that I have drawn, as the molar concentration of Hydrogen Peroxide goes down, so does the amount of 02 produced. An obviously, the higher the molar concentration of Hydrogen Peroxide goes up, so does the amount of 02 produced.
This agrees with my prediction quite closely, as I said that the less H2O2, the slower the rate of reaction, and so the less 02 produced.
Another thing that I can tell from looking at my graph is that as the lines are pretty straight, that the reaction is directly proportional to the amount of times that passed.
There is however one anomaly that occurs in the line of concentration of Hydrogen Peroxide: 0.83M. I think that there are several possible reasons for this. It could be human error, or that I may have had some imperfections on my equipment, or slightly inaccurate solutions.
Evaluation: If I were to do the experiment again, I would repeat the experiment more often, and then remove the top and bottom 15% so as to remove all anomaly results. Then I would be able to produce a graph without kinks in, or so I believe.
I do however think that my results were accurate enough, as except for the odd one or two strange results, they kept in a straight line. As with most experiments, I am sure that they could be more accurate. There are several reasons for this. I could have read my instruments wrongly. I may have had some imperfections on my equipment, or slightly inaccurate solutions.
To further this work, I could experiment with the amount of Manganese (IV) Oxide in the solution and see how that affects the experiment. Other experiments that I could try are by changing the temperature, or the brightness of light, or something else entirely.