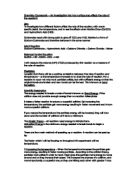
2) Concentration of acid - If an acid is used in a reaction the concentration can help to affect the rate. If the solution is made more concentrated it means that there are more particles of reactant knocking about between the solution, which makes collisions between important molecules more likely. This means that there is a higher chance of collision because there are more acid particles. Due to more collision the speed of the reaction will increase. With a lower concentration the opposite effects will occur. The reaction will be slow and more likely to not occur.
Low Concentration High Concentration
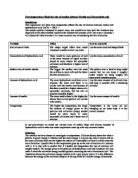
3) Catalyst – A catalyst is a substance used to speed up a reaction without being used up. Introducing a catalyst into a reaction will mean that less energy will be required to create a successful collision. This is known as lowering the activation energy. They provide a surface for the particles to stick on where they can bump into each other. However each reaction needs its own unique catalyst.
Catalyst (Purple) – Reactant particles (Yellow and dark grey)
4) Surface area of limestone (calcium carbonate) – When the surface area of a solid is increased, meaning it has been turned into a powder form, the rate of reaction will increase. This is because there are more particles (calcium carbonate) to react with the other reactant (hydrochloric acid solution), therefore more successful collisions per second. This means the frequency of the reaction will increase. If there is less surface area e.g. limestone in lumps then the rate of reaction will decrease because there is less area for the solution to work on.
There is a simple way to visualize this. Take a loaf of bread and cut it into slices. Each time you cut a new slice, you get an extra surface onto which you can spread butter and jam. The thinner you cut the slices, the more slices you get and so the more butter and jam you can put on them. This is the "Bread and Butter” Theory.
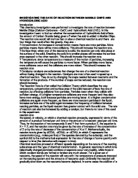
The diagram clearly shows an exothermic reaction is taking place “Heat evolved during reaction” and that an increase in energy causes acceleration in the speed of the reaction.
The graph to the left summarizes the differences in the rate of reaction at different temperatures, concentrations and surface areas.
The steeper the line, the faster the rate of reaction. Reactions are usually fastest at the beginning when the concentration of reactant is greatest.
When the line becomes horizontal the reaction has stopped as all the reactants have been used up.
Risk Assessment
To ensure the experiment is carried out safely:-
- Wear goggles – can damage eyes if it comes in contact
- Gas syringe cannot exceed capacity – this will lead to inaccurate results and syringe breaking
- Be cautious when handling HCL, ensuring that any
Spillages are cleaned up immediately, and hands are washed thoroughly
- Place apparatus in correct position (not on floor)
Fair Test
-
Mass of marble chips (5g)
-
Volume of acid (20ml³)
-
Concentration of acid (1 mole)
-
Collecting same volume of gas (30ml³)
- Doing repeats
- Using the same apparatus
- Surface area – not exact due to chips being different sizes
- Collecting results 3 times
I will try to apply all these fair test conditions when performing the experiment. This way I will gain the best and most accurate results.
Apparatus
- Graduated Gas syringe – measure volume of CO2 produced
- Conical flask – where reaction took place
- Thermometer – measure HCL temperature
- Pipette – accurately fill measuring cylinder with HCL
- Kettle – heat water
- Measuring cylinder - measure volume of HCL
- HCL (20ml³/trial) – reactant
- Marble chips (5g/trial) – reactant
- Pen & Paper - record results and analyse experiment overall.
- Rubber Bung – to prevent gas escaping into the air
- Stopwatch – record time taken to collect 30ml³of CO2
- Electronic scales to 2 decimal places – allows accurate measurements of marble chips
Method
After setting up the apparatus, ensuring that the gas syringe and conical flask are securely clamped;-
- Switch on kettle
- Weigh 5g of CaCO3 using electronic scales
- Weigh the same amount 2 more times sand place a piece of tissue
- Put CaCO3 into conical flask
- Measure 20ml³of HCL using measuring cylinder - use pipette for exact measurement and read volume at eye level
- Pour hot water from kettle into an empty beaker
- Place HCL measuring cylinder into hot water beaker
- Wait until HCL is heated to required temperature (no heating needed for 20°c as it is RT) - measure temperature by placing thermometer into HCL
- Before pouring heated HCL into conical flask check that the gas syringe and conical flask are secure, one end of the rubber bung is attached to the gas syringe and most importantly the reading on the gas syringe is zero
- Pour HCL into conical flask carefully, making sure that none is spilt
- Simultaneously start the stopwatch when rubber bung has been successfully fitted onto conical flask
- Record time taken to collect 30ml³of CO2
- Record results into table
- Repeat this method 3* for each temperature (20-60 degrees) to ensure reliable results.
- For every trial pure HCL and new CaCO3 must be used. The conical flask must be rinsed to remove any products from the previous trial and the gas syringe must be reset to zero
- When disposing reactants - they must be disposed into a bucket as they can be harmful
- Finally take an average of all the results and then record these results onto a graph (shown on final pages)
I will record my results into this table:-
Pilot Test
I am now going to construct a pilot test to my method. In addition, I am going to carry out the method to see if I need to make any changes.
After constructing a pilot test, I have come to the following conclusion to amend my method:
I need to make certain changes to my method, for example to achieve more accurate results I will ask my partner to reset the stopwatch and time the experiment as one person cannot do it themselves and also achieve reliable results.
Also I will replace or re-assure all equipment is placed in their original position before starting at a new temperature (after 3 mini experiments)
I have recorded these results after completing the experiment.
Analysis
After conducting my experiment I have discovered - as temperature increases so to does the rate of reaction.
As can be seen from my graph, when the temperature is 20°C the time taken to collect 30ml³ of CO2 is 40 seconds. However when the temperature is increased to 65°C, the time taken to collect 30ml³ of CO2 is only 11 seconds. This clearly shows to prove that my prediction was correct.
The graph shows a smooth curve which becomes more horizontal as it reaches higher temperatures. This is because at whatever temperature, the reaction will never be instantaneous.
Proving Scientific Explanation (After result)
After analysing my evidence and using my scientific knowledge I know that for a reaction to occur not only must particles hit each other, but they must collide with sufficient energy so that the original bonds are broken and new bonds can be formed (bond formation)
The energy needed to break a mole of bonds is known as Bond Energy. If the collision does not provide enough energy then no reaction takes place.
It takes a faster reaction to ensure a successful collision. By increasing the temperature, the particles get more energy. According to the collision theory, particles must collide in order to react. By raising the temperature particles increase their speed. For example: if someone is cold and they start to run they will run slower than if they have warmed up. As I raised the temperature it took less time for 30ml3 of carbon dioxide to be produced in the gas syringe.
20 degrees – 40.29 seconds
45 degrees -
If you reduce the temperature the particles energy will be lowered, they will slow down and the number of collisions will be to a minimum. This resulting in a slower rate of reaction.
Evaluation
The method I used to carry out the experiment was specific and easy to follow. I do not believe that anything I did was done unnecessary. It gave me accurate results which enabled me to plot a graph with a line of best fit.
The fact that my results were consistent enough through the trials shows to say that there were no anomalous results.
As can be seen from my results table and graph all the trials are close, give or take a tenth of a second. This is due to the fact that it is very difficult to obtain the exact time for every trial, as not everything can be controlled perfectly in a classroom experiment.
Furthermore and average was taken. These averages were then plotted on a graph. The line of best comfortably goes through all my points plotted. This backs up the fact that I did not obtain any anomalous results.
The experiment could have been improved in many ways. I could have used beads of Limestone instead of chips to solve the problem of unequal sized particles. This may have given me slightly more accurate results.
Also I could carry out a greater number of trials for each temperature to make certain that my results were accurate.
There are many possible extensions to this experiment. I could try to investigate the effects of using other Carbonates (Sodium Carbonate) and react them with HCL.
Furthermore I could use concentration as my variable. If this was considered I would have to take into account other precautions and variables, e.g. what kind of water would be used for concentrating the acid.
In addition to this, to make the experiment into a more detailed and depth one, I could’ve added a catalyst to the experiment.
Also instead of using hydrochloric acid I could’ve used another acid, for example sulphuric acid. I could’ve then seen the changes of which acid reacts best with limestone (calcium carbonate).
Riaz Rampuri 11c2