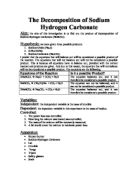
Graph Showing How Energy Levels of a Reaction Vary With Time
As an increase temperature makes particles move faster the frequency of collisions increases. This does affect the R of R but the main increase in the R of R comes from the particles possessing more KE and thus increasing the probability of a collision resulting in a reaction.
The reaction that causes hydrogen peroxide to decompose is a very slow one. It would take far too long to collect results if left on its own. That is why a catalyst is added to the solution. The catalyst speeds up the reaction by providing an alternative reaction path with a lower activation energy by the process of heterogeneous catalysis:
The bonds of hydrogen peroxide break naturally, as hydrogen peroxide decomposes, and reform to create the new products. However they break very slowly as the activation energy for the bonds to break is very high. The catalyst provides a reaction path with lower activation energy.
The catalyst allows the reaction to take place in two smaller steps, firstly an oxygen atom from each H2O2 breaking off and being adsorbed to the surface of the manganese (IV) oxide. Secondly the oxygen forms a new bond with another oxygen molecule. Both of these steps require less energy than the energy required without the catalysts presence. Without the catalysts presence the reactants have to collide with sufficient energy for the H-O bond to break, allowing the two H2O molecules to form, and also to form the O-O bond, allowing the O2 molecule to form. These have to happen in one collision that has to have sufficient energy for both processes to occur whereas the reaction with the catalyst only needs enough energy for one of the processes. Therefore there is lower activation energy.
Graph Showing How Energy Levels of a Reaction With and Without The Presence Of a Catalyst Vary With Time
If there is a lower activation energy, more collisions result in a reaction. If more collisions react the R of R is faster. This allows us to collect data in a short time period.
The surface area of the catalyst affects the R of R as a higher surface area provides a larger area for hydrogen peroxide to be adsorbed. Thus more hydrogen peroxide particles are absorbed per second and more products are formed each second. Thus the R of R is quicker.
A larger mass of catalyst results in the catalyst having a larger surface area, assuming catalyst is in a powder form. Thus the greater the mass of powdered catalyst the quicker the R of R.
The type of catalyst used will affect the R of R because different catalysts provide different activation energies and if there is higher or lower activation energy the R of R is altered.
Fair test:
The Concentration of the Hydrogen peroxide will be varied. The amount that it is varied will be determined during the prelim. The concentration will be varied by adding water to the solution. If water is added the concentration is lowered. Varying the concentration is the easiest variable to vary. Varying the mass of catalyst would result in a narrower range of results. Varying the temperature would take too long for the apparatus to be ready. Varying the surface area of the catalyst is extremely hard to measure. Altering the type of catalyst would not give a range of data, just figures that would show which the most effective catalyst is.
The Temperature that the experiment is conducted at will be at room temperature. This may vary throughout the experiment however it is hoped that the variation in the temperature will not significantly alter the experiment seeing as the change in temperature will not be above a degree or two.
The type of catalyst will be manganese (IV) oxide (MaO2(s))
Safety:
- Safety spectacles will be worn at all times
- Care will be taken not to touch any chemicals with bare skin. Manganese (IV) oxide will be handled using a spatula to prevent it sticking to fingers and being brushed of throughout the laboratory, hydrogen peroxide will be handled using measuring cylinders and if necessary a pipette due to the fact that hydrogen peroxide is a bleach and also corrosive and can damage skin and eyes.
- Burettes will be handled carefully so as to avoid them shattering, causing possible injury in doing so.
- It will be ensured that clamp stands are stable before clamping the burette to it.
Accuracy:
There are several things that have to be taken into account when collecting the data:
- Parallax error, this will be avoided by keeping the eye level with the water level
- Human reactions, human reactions have to be taken into account seeing as it takes time for one to realise the volume has been produced and stop the stop clock or realise that the time has elapsed and measure the amount of oxygen that has been produced.
Prediction:
I predict that the higher the concentration of hydrogen peroxide the faster the reaction will take place. I predict that this will be true until a certain point where the R of R will not increase any further unless other factors are altered. This is because of limiting factors such as the surface area of the catalyst. I predict that this will not completely happen in this experiment however the R of R will approach its fastest rate given the limitations imposed by the variables that have been fixed.
Prediction curves:
Graph showing how the concentration of hydrogen peroxide affects the rate of reaction
Graph showing how the concentration of hydrogen peroxide affects the time taken to displace 30cm3 of water in the burette
Preliminary experiment:
The maximum and minimum concentrations (100% and 10% respectively) were tried to find out if they would produce measurable results. The main purpose of the preliminary experiment was to determine the right amount of catalyst to use to provide results that were both as accurate as possible while still providing results that could easily measured. It was decided that the best way of collecting results was to measure the time it took for the oxygen to displace 30cm3 of water. This was because the time limit was flexible and thus the experiment time would lengthen or shorten to collect the results whereas if the amount of water being displaced in 30 seconds was measured if the time taken to displace all the water in the entire burette was 29 seconds then the experiment would have to be repeated with a different amount of catalyst.
Results:
When the reactants put into the conical flask (hydrogen peroxide concentration = 100%) the reaction took less than a second. This was too fast to accurately measure and so the amount of catalyst was decided to be altered to a more appropriate amount, one that would provide measurable results for all concentrations of hydrogen peroxide.
The amount of catalyst was changed to 0.5g as it was deemed that this would accelerate the reaction to a far lesser extent allowing a reading to be taken. However the result produced with 100% Hydrogen Peroxide was under a second and so the decision was again made to reduce the amount of catalyst. The catalyst was again reduced to 0.2g. This produced a result of 6:56 seconds. This was a long enough time for us to be able to measure the time taken to displace 30cm³ of water in the burette and so it was decided that 0.2g would be the amount of catalyst used for the rest of the experiment. We then repeated the experiment twice more, to provide three repeats. Results two and three were 10:54 seconds and 3:27 seconds respectively. Result three is three times the size of result two. The average of the three results was 07:05 seconds while the variation between results was 07:27 seconds. This means that the variation between results was larger than the result itself, which provides very inaccurate results. As a result it was decided that decreasing the amount of catalyst further would increase the time taken to displace 30cm³ of water in the burette. And thus provide results with a smaller variation in time in proportion to the time taken to displace 30cm³ of water in the burette.
The amount of catalyst was changed to 0.1g and this provided a time of 16.16 seconds. A second result provided a result of 14.80 seconds. We then ran out of time to conduct a third repeat. The two results collected provide an average of 15.48 and a variation of 1.36 seconds. These results were far closer together providing a far lower percentage of error and so 0.1g was the amount of catalyst that was decided to be used during the experiment.
Table Showing Results Obtained During the Preliminary Experiment
From the preliminary experiment the following things were discovered that alter the plan:
- 1g of Manganese (IV) Oxide is too much to produce measurable results the amount of catalyst used was reduced to 0.1g
- It was decided that measuring the time taken for the reaction to produce 30cm³ of oxygen would be the easiest way to find the rate of reaction.
Experiment:
The experiment was conducted as was the preliminary while using 0.1gofcatalyst for each concentration of Hydrogen Peroxide.
Results:
* = Anomaly – this result was not used when averages were being calculated.
** = Amount of oxygen produced divided by the time it was produced in:
30cm³ / The Average of the Three Repeats
Graphs:
Conclusion:
As the Concentration of the Hydrogen Peroxide increased the rate of reaction increased. This supports my prediction; however the R of R was directly proportional to the concentration of Hydrogen peroxide which does not support my prediction as in my prediction I predicted that there would be a point where the rate of reaction would not increase any further due to limiting factors, such as the surface area of the catalyst. This was an incorrect prediction as the R of R stayed constant throughout. The ‘Chart Showing How the Rate of Reaction of the Decomposition of Hydrogen Peroxide Varies When the Concentration of the Hydrogen Peroxide Is Varied’ illustrates this and shows that although the points are not exactly on the line of best fit they do not show any signs of the rate of reaction reaching a point at which it could no longer increase.
There was an increase in the R of R, and thus a decrease in time taken for the reaction to produce 30cm³ of oxygen, due to the fact that as the concentration of the H2O2 increases the number of particles per cm³ increases. The more particles per cm³ the more collisions that take per second and the more collisions taking place per second the more reactions that take per second. The more reactions that take place per second the faster the R of R.
Evaluation:
The procedure allowed me to observe the affects of concentration upon the R of R of the catalysed decomposition of hydrogen peroxide. It provided me with three repeats so that a reliable average could be taken. Averages are more reliable than using one result as they take into account variation between results. Taking an average of several results creates a measurement in the middle of the variation created by the experiment, which is the result that is closest to the time that would be recorded for the Hydrogen Peroxide to produce 30cm³ of oxygen if it were measured in an experiment that was totally accurate.
Table showing Variation Between Results
= Anomaly
Anomalies are very easy to spot when results are put into a graph like the one on page 21. Any anomalies have been circled with a red circle.
Anomalies were included when working out the variation between results seeing as any anomalous results were produced by the experiment and are therefore part of the variation between results produced by the experiment. The average variation between results was 14.73 seconds. This is a large percentage (over 50%) of some of the quicker reaction times. However the variation of each concentration is below 50% of the average reaction time.
The average variation in results is brought up by the large variation between results recorded for concentrations of 10% and 20% H2O2. The other results have much smaller variations between results. The Variations between results recorded for concentrations of 10% and 20% H2O2 are only large in comparison to reaction times of more concentrated solutions and are small in comparison to their own reaction times.
Seeing as the However the variation of each concentration is below 50% of the average reaction time the evidence is accurate as
There was only one result that was classed as an anomaly however the points in the ‘Chart Showing How the Rate of Reaction of the Decomposition of Hydrogen Peroxide Varies When the Concentration of the Hydrogen Peroxide Is Varied’ are not very close to the line of best fit.
In this experiment variation was created by several things that could have caused inaccuracies and anomalies:
-
The scales only measure to two decimal places and therefore are only accurate to ±0.005g. When measuring 0.1g of manganese (IV) oxide, a ±0.005g variation is quite considerable, 5% of the total mass of the catalyst. This means that one mass of catalyst can be 0.01g larger than another which the balance say is equal to the first mass. This means a larger mass of catalyst is available to collide with the H2O2 creating a faster R of R.
-
The MaO2 came in powder form. This meant that the surface area of the particles had to be taken to be the same. However this was not always true as particles could have been different sizes and some particles may have stuck together, thus reducing their surface area and affecting the R of R
-
Human error meant that when measuring out the concentrations using the measuring cylinders they could have had slightly higher or lower amounts of each liquid than they were supposed to have, which could have affected the concentration of H2O2.
-
While the solid was being transported in the weighing boat MaO2 could have stuck to the tray meaning that <0.1g was transferred to the conical flask with side arm
- After each time the conical flask was used it was rinsed however it was not possible to dry out the conical flask each time it was used due to time limitations and practicality. This means that water could have resided inside the flask diluting the solutions further.
This means the procedure had various short comings. More accurate scales could have been used. The liquids could have been measured out using syringes to make sure the volumes were exact. The weighing boat could have been measured before and after the experiment in order to know exactly how much MaO2 was transferred. The conical flask could have been dried out thoroughly after each time that it was used. More repeats could have been conducted. More concentrations could have been tested
Nevertheless the evidence collected supports my conclusion and is reasonably accurate as the evidence is quite close to the line of best fit which shows that the experiment was carried out quite accurately. The Evidence is valid as although there were lots of factors that could have affected the results to create anomalous results, anomalies were not used when calculating averages. As the averages were taken, this writes off most variation that is caused by inaccuracies in the experiment. Therefore the evidence is reliable. The evidence is sufficient to support my conclusion seeing as there are a large number of points which all follow the same trend.
If I was to carry out further work I would try to make the experiment far more accurate than this one. To do this I would do the following:
- Use a more accurate Balance
-
Use syringes to measure out the concentrations of H2O2
- Weigh the measuring boat before and after the experiment
- Dry the conical flask out thoroughly each time
- Carry out more repeats
- Use more concentrations –1%, 2%, 3%, 4%, 5%…etc.
-
Use a larger mass of MaO2 - This would provide more accurate results seeing as the scales are only accurate to ±0.005g. In a mass of 0.1g there is a 5% error however in a mass of 5g there is only a 0.01% error. Therefore the larger the mass of catalyst used, the more accurate the result.
However in this experiment it was discovered that using any mass of MaO2 larger than 0.2g provided immeasurable results and any mass over 0.1g provided inaccurate results. Therefore if any further work was going to be carried out a change of method would be needed.
The following method will be used:
Apparatus:
Conical flask, Electronic balance, Hydrogen peroxide, Manganese (IV) Oxide, Safety spectacles, Spatula, Stop clock, Weighing Boat
- 5g of Manganese (IV) oxide will be measured out using an electronic balance.
-
20cm3 of Hydrogen peroxide solution will be measured out into a measuring cylinder using syringes.
-
The Manganese (IV) Oxide will then be placed in a conical flask. The Weighing boat will then be re-weighed. The total amount of MaO2 in the flask equals the weight of the boat and the MaO2 before the MaO2 has been tipped in take away the weight of the boat on its own after the MaO2 has been tipped in.
- The flask and its contents will then be weighed using the electronic balance.
- The Conical flask will be removed from the scales and the 20cm³ of Hydrogen Peroxide will be poured in. The stop watch will be started immediately.
-
The reaction will then take place. Oxygen (O2) and water (H2O) will be produced.
2H2O2(l)→2H2O(l) + O2(g)
The oxygen produced will leave the conical flask out of the opening at the top.
- When Reaction is no longer taking place the stopwatch will be stopped. The Conical flask will then be reweighed. The difference in weight from the start to the end of the reaction is the mass of the oxygen given off.
- The R of R = Change in mass/time taken for reaction to stop reacting.
- The flask will then be rinsed and dried thoroughly before being reused.
- This will be repeated 5 times for each concentration from 1% to 100% in steps of 1%, this will provide results that will be far more accurate and reliable.
This experiment allows a larger amount of catalyst to be used and therefore is more accurate. Also all of the oxygen that escapes is measured whereas in the first experiment some of the oxygen escapes without being measured in the space of time between when the H2O2 is poured in and when the bung is replaced.