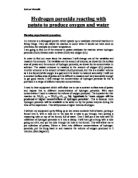
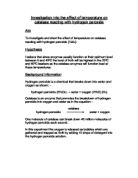
I will set my equipment up by filling up an ice cream container full of water, putting a funnel into it, with a hole cut in the side for a tube to go through, then putting a measuring tube on top of the funnel, full of water. Then I will put a test tube with 20 millilitres of hydrogen peroxide in it into a clamp. I will then get a bung with a tube going out of it, and put the tube through the hole in the funnel. This will allow me to put cylinders of potato, 30mm x 5mm into different concentrations of hydrogen peroxide, put the bung back in and measure the volume of oxygen produced in 5 minutes. (See diagram1).
Diagram 1
Apparatus to be used to measure the volume of oxygen produced by hydrogen peroxide and potato.
Obtaining evidence
I set up my equipment as I have already described. I measured 20mls of hydrogen peroxide with a measuring cylinder and syringe, taking care not to spill any. I put this into the test tube. I used 30mm x 5mm cylinders of potato which I cut using a precision cylinder cutter. Then measured with a ruler and cut with a scalpel. For each trial I put the cylinder of potato into the test tube which contained hydrogen peroxide. I used the following concentrations of hydrogen peroxide: 0%, 5%, 10%, 15% and 20%.
For each trial I measured the volume of oxygen collecting in a measuring cylinder as it displaced water into the ice cream tub.
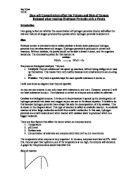
For each concentration of hydrogen peroxide, I was prepared to carry out four trials and discard the result least similar to the others (the anomaly). I did this for concentrations of 20% and 15%, but not for 10% or 0% as these results were similar. Unfortunately I did not have enough time to conduct four trials with 5% of hydrogen peroxide where test three may be an anomaly. (See table 1 below).
Table 1
For 20% and 15% concentrations of hydrogen peroxide the anomaly was test number two. I have already explained why I have not done an extra test for 5% concentrations and for 10% and 0% the results of the tests are similar.
Analysing evidence and drawing conclusions.
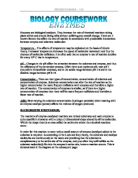
I have found that my hypothesis is true, ‘more oxygen will be produced at higher concentrations of hydrogen peroxide’. I have demonstrated this in graphical form in graph 1, where I have plotted concentration of hydrogen peroxide solution against volume of oxygen produced. As can be seen from the line of best fit (red), there is a steady gradient with progressively more oxygen produced as the concentration of hydrogen peroxide rises.
However if the points on the graph are simply connected (black), the graph takes on an ‘S’ shape. This could be further confirmed by carrying out more tests at other concentrations of hydrogen peroxide, e.g. 1%, 2%, 3% ... to fill in the gaps between the concentrations we have used. The volume of oxygen produced in five minutes is related to the rate of the reaction in which hydrogen peroxide is broken down to water and oxygen. The gradient of the graph shows the change of rate of the reaction. The rate increases most rapidly where the graph is steepest (between 5% and 10% hydrogen peroxide solution). It seems that at higher concentrations of hydrogen peroxide, the rate of the reaction increases more slowly. If the graph was continued for higher concentrations of hydrogen peroxide (e.g. 25%, 30%...) it seems likely that the graph would continue to flatten out, eventually, possibly, becoming horizontal. This would indicate that the rate of reaction no longer increased when the concentration of hydrogen peroxide increased. This would be shown by the same amount of oxygen being produced by the reaction caused by potato at each higher concentration of hydrogen peroxide.
One possible conclusion which could be drawn from the flattening of the graph at higher concentrations of hydrogen peroxide is that all of the potato now being used to catalyse the reaction. The effect of the enzyme would have been maximised.
At lower concentrations of hydrogen peroxide (e.g. below 5%) the rate of increase of the reaction also changes, as shown by the gradient of the graph. If this could also be confirmed as I have described already, then we could draw a conclusion about the action of the enzyme. This would be that as the concentration of hydrogen peroxide rises from 0% the rate at which the enzyme catalyses the reaction initially rises more quickly than the increase in concentration of hydrogen peroxide. However, as our readings for the 5% concentration of hydrogen peroxide are under question it is very difficult to draw accurate conclusions as the graph in this area depends on the accuracy of this point.
Graph 1
To show the average volume of oxygen collected in five minutes from the reaction of hydrogen peroxide at different concentrations with potato
Evaluating evidence
I have a number of queries about my results and some suggestions for improvements.
-
The average volume of oxygen produced for 5% concentration of hydrogen peroxide is questionable. The three readings I took are 0.5 cm3, 0.4 cm3 and 1.2 cm3. To keep to the guidelines, I should have taken another reading and discarded the anomaly.
- Because there is still some difference between the readings for tests of the same concentration of hydrogen peroxide, even when the anomaly is discarded, it would have been more accurate to take a higher number of readings for each concentration (e.g. 10 readings).
- Because it seems that the graph may not follow a straight line, a more accurate picture might appear if readings were taken for more different concentrations of hydrogen peroxide (e.g. at 1% intervals).
- Because the graph seems to flatten out at the highest concentration of hydrogen peroxide (20%), I could have got a better idea of the reaction if I had taken readings at higher concentrations (e.g. 25%, 30%).
- The results could also have been made more accurate if I ha more time to carry out the experiment. Because of time pressure my partner and I hurried with the experiment, and the measurements of the size of the potato and the volume of hydrogen peroxide where sometimes hurried. They were not as accurate as they would have been if we had more time.
- The measurement of the volume of oxygen produced could have been more accurate. This could have been achieved with a taller, thinner measuring cylinder so that the vertical distance between the volume markers was greater. It would also have been easier to measure accurately if the measuring cylinder was made of clear glass instead of plastic.