Rate of reaction
7
pH
To ensure that this experiment is a success the pH will be kept constant at pH 7 throughout the experiment using a pH 7 buffer solution. This pH has been chosen to imitate the pH in which catalase is best suited to.
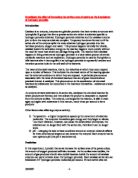
Temperature – The following graph shows the effect of temperature on the rate of reaction.
Rate of reaction
37 oc
Temperature
From observing the graph it is very clear that there is an optimum temperature at which the enzyme catalase works best at. This seems to be at 37 oc. At below this temperature the rate of reaction steadily gets slower. This is because the particles are moving around slowly so there are relatively low chances of successful collisions. As the temperature increases so does the rate of reaction. This is because increased temperature means that the enzyme and substrate molecules move around more faster due to the increase in kinetic energy. This means that collisions between the active site and substrate occur more frequently and with enough energy to break the bonds and to start a reaction. However after 37 oc as the temperature continues to rise the rate of reaction starts to decrease. This is because the extra movement and vibration causes the weak hydrogen bond (which maintain the shape of the active site) to break altering the shape of the active site. As the substrate will no longer fit in to the active site the enzyme activity starts to decrease. The enzyme has now become denatured.
To ensure that this experiment is a success the temperature will be kept constant at 37 oc throughout the whole experiment using a water bath. This value has been chosen because from looking at the graph it is very clear that catalase works best at this temperature.
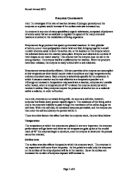
Substrate concentration - The following graph shows the effect of substrate concentration on the rate of reaction.
Rate of reaction
Substrate concentration
From observing the graph it is clear that as the substrate concentration increases so does the rate of reaction (but only if the enzyme concentration is kept constant). This is because the higher the substrate concentration the more substrate molecules there are, which means more substrate can be broken down in a given time. However when a certain point is reached known as the Vmax , all the enzymes are saturated at one point so no matter how much more substrate is added the rate of reaction stays constant as the enzymes cannot work any faster. At this point the substrate concentration is the limiting factor.
To ensure that this experiment is a success the substrate (hydrogen peroxide) concentration will stay constant at 10ml throughout the experiment. To ensure that it is measured accurately a syringe will be used. The strength of the hydrogen peroxide used will be 80 vol. A high strength is being used to prevent the substrate concentration from becoming a limiting factor.
Enzyme concentration – The following graph shows the effect of enzyme concentration on the rate of reaction (only if there is excess substrate)
Rate of reaction
Enzyme concentration
From observing the graph it is clear that as the enzyme concentration increases so does the rate of reaction. This is because the more enzymes there are the more active sites there are. This means that more substrate can be broken down at one point in time so the rate is higher. This is true only if there is excess substrate available. If there is a short supply then increase in enzyme concentration has no effect on the rate of reaction.
Enzyme concentration will be the independent variable in this experiment. I will vary the amount of catalase by changing the surface areas of the potato cylinders. As potato contains catalase it can be said that the higher the surface area the higher the enzyme concentration.
Even though the surface area of the potato cylinders need to be varied the volume and mass needs to be kept constant otherwise the experiment will not fair and no conclusions can be drawn from the results. . The only way this can be done is by starting with a potato cylinder 10mm in diameter and 50 mm in length. This will be the first surface area that will be tested. By getting another potato cylinder 10 mm in diameter and 50 mm in length and cutting it in half to get two cylinders each 25mm in length the second surface area will be gained. From looking at the table on page 8 it is clear that the total surface area of these two cylinders is higher than the surface area of the 50mm cylinder but the volume and mass are the same. This means that cutting the 50mm cylinder in to cylinders smaller in length increases the surface area without varying the volume or the mass.
To be able to draw conclusions on whether enzyme concentration affects the rate of reaction, 5 different surface areas (enzyme concentration) will be tested. This will be done by first cutting out 5 potato cylinders that are identical in size. The cylinders will all have a diameter of 10 mm and a length of 50 mm. One of the 50 mm cylinders will be the first surface area that will be tested. The second surface area will be found by halving another cylinder. The third will be found by dividing another cylinder into threes. The forth will be found by dividing another cylinder into quarters and the final surface area will be found by dividing the last potato cylinder into fifths. This is shown more clearly in the following diagram.
In this investigation the independent variable is going to be the surface area of the potato cylinders. The dependent variable is going to be the time taken for the meniscus to move up the manometer tube by 5 cm. The fixed variables are going to be the volume of hydrogen peroxide, which is going to stay constant at 10 ml, the temperature, which is going to stay constant at 37 oc, and the pH, which is going to stay constant at Ph 7.
Apparatus:
- Razor Blade
- Cork borer
- Tile
- Petri dish
- A Manometer with manometer fluid
- Bung
- Boiling tube rack
- A ruler
- 300 ml pH 7 buffer solution
- 2 syringes
- A stop watch
- Marker Pen
- 300 ml of 80 vol hydrogen peroxide
- 1 large potatoes
- Automated water bath
- Thermometer
- Boiling tube
Method and justification
- Using a potato borer bore a tube 10mm in diameter from a potato, then with a ruler and a razor blade cut out 2 pieces each 25 mm in length and place it into a petri dish.
From looking at the table on page 8 you can see that the total surface area of these pieces of potato is 1885 mm2.
- Arrange a boiling tube securely in a boiling tube rack and place the potato cylinders into it.
- Using a syringe add 10 ml of pH 7 buffer solution to the boiling tube.
ph 7 is being used, as this is the optimum pH for catalase at which it is most efficient. This buffer solution will maintain the pH constant throughout the experiment so that the activity of the enzyme does not vary and increase the inaccuracy of the results.
-
Place this boiling tube into an automated water bath already heated up to 37 oc. Then insert a thermometer in to the boiling tube and wait until the temperature has reached 37 oc before taking it out.
The temperature of the solution will be kept at 37 oc as this is the optimum temperature for enzyme activity. The automated water bath will ensure that the temperature is kept constant throughout the experiment so that the changes in temperature does not vary the enzyme activity and disrupt the accuracy of the results.
- Next using a bung, attach a manometer containing manometer fluid to the boiling tube. This is shown in the following diagram.
- Holding the manometer level, use a marker pen to mark the point at which the fluid is at its lowest point. Then using a ruler measure exactly 5 cm above the point and mark it.
- Next measure out 10ml of 80 vol hydrogen peroxide using a syringe. Care should be taken to ensure that the meniscus is lined up with the 10 ml mark and that all air bubbles are removed.
Taking such care will make sure that the amount of hydrogen peroxide (substrate concentration) is constant throughout the experiment so more reliable result is given.
80 vol hydrogen peroxide is being used to make the substrate a lesser limiting factor.
- Add the hydrogen peroxide in to the boiling tube. As soon as you have added it replace the bung and start the stopwatch.
It is important to replace the bung as quickly as possible so that the smallest of oxygen is lost.
- Slowly, the fluid will start to rise as the reaction takes place. Measure the time taken for the fluid to reach the second marked point. This is a distance of 5 cm.
When the fluid has reached this point open the rubber clip on top of the bung. This will return the manometer fluid to its original position.
- Now take the bung of the boiling tube and remove the hydrogen peroxide and buffer solution leaving only the potato behind.
- Put the boiling tube back in to the water bath and add 10 ml buffer solution of and 10 ml of buffer solution in to it. As soon as you have added the hydrogen peroxide replace the bung with the manometer and time how long it takes for the manometer fluid to travel up by 5 cm.
- Repeat step 9 and 10 and work out the average of the three readings.
By repeating a surface area (enzyme concentration) several times I can work out the average and minimise inaccuracy.
- This experiment should be repeated for different total surface areas. The different total surface areas are shown in the table below.
(At 0 mm in length no potato will be added to the solution. This will act as a control.)
The surface area of each cylinder was found using the following formula:
Surface area = 2(πr2) + Lπd
L= Length (mm)
d= Diameter (This is always 10 mm)
r= Radius (This is always 5 mm)
The total surface area was found by multiplying the surface area of each cylinder by the number of cylinders.
The total volume was found using the following formula:
Total volume = Lπr2
Health and safety
- Labs must be worn throughout the experiment.
- Goggles must be worn to protect eyes
- Gloves must be worn to protect hands against hydrogen peroxide (which is corrosive)
Bibliography
- Advanced Sciences, Biology 1, Pages 42-48
Jones, Mary
Fosbery, Richard
Taylor, Dennis
Factors effecting enzymes