This is called Ohm’s Law. Therefore when the length of wire increases it will have to collide with more particles meaning a bigger currant is needed and the wire will heat up. There is also another formula which I did not know about until I began investigating resistance:
“Resistance, in ohms (R) is also equal to the resistivity of the wire, in ohm-meters (ñ) multiplied by the length, in meters (l) divided by the cross sectional area, in square meters (A).”1
The cross sectional area of the wire is the same therefore we can see from this formula that the resistance is proportional to the length of wire used.
1 The Usborne Illustrated Dictionary of Science; C.Stockley, C.Oxlade & J.Wertheim
PLAN & METHOD
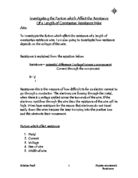
Here is a circuit diagram for the experiment that I will carry out to investigate the resistance of the wire.
For this experiment I will use the following apparatus:
A length of Wire (30 swg [standard wire gauge])
Power supply
Voltmeter
Ammeter
Connecting Box
As the length of the wire is the only variable this makes the whole process much easier to organise and execute effectively. I will alter the length by changing the amount that is sticking out of the connecting box. I will take 7 readings at the following lengths:
0.2m
0.4m
0.5m
0.6m
0.8m
1m
1.5m
I will then repeat these readings once more to try and to take into account any errors and find any anomalies that may have occurred. As we have already established I will keep the diameter (30 swg) of the wire the same, the voltage and will try to keep the temperature range down to a minimum by taking all these results on the same day so there will be little variation that could affect the resistance.
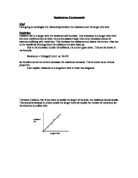
When I have collated these results I plan to use Ohm’s Law to find out the resistance of the wire for the given length using the formula so I can draw a graph to try and prove that my hypothesis was correct:
Resistance [Ω (ohms)] = Volts [V] / Amperes [I]
I will then draw a graph with the length of the wire along the x axis and the mean resistance of the wire along the y axis. If my hypothesis is correct I would expect it to be in a straight line like this and would show that length is directly proportional to resistance:
RESULTS
To work out the resistance of the length of wire I took the Voltage (V) and divided it by the Current (I) to achieve the Resistance (Ω). This is called Ohm’s Law.
1st Attempt
2nd Attempt
Average/Mean of two results
Preliminary observations shows that the voltage increases as the wire becomes longer while the current decreases to the wire become longer. Looking at these results there seem to be no anomalies at a first glance but it will be easier to see any once a graph of these results has been drawn (see attached graph)
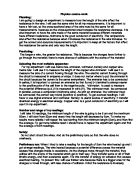
ANALYSIS OF GRAPH
Analysing the graph we can see that there is only one result that does not through the line of best fit. I am putting this down to an experimental error. However the amount is only small as it is not very far from the line. We can see that the increase is constant by using the following calculation:
As the length goes from 0.4m to 0.8m then the resistance goes from 2.5Ω to 5.25Ω which is a factor of 2.1 (close to 2).
We must also note that the gradient of the line of best fit is:
- This was calculated using the following equation:
CONCLUSION
From looking at my results I think that I can comfortably say that my hypothesis:
“I predict that if we double the length of the wire the resistance will double therefore showing a direct correlation between the two.”
is definitely correct. I say this because if, when the length of the wire increases, the resistance increases by a factor of almost 2 (2.1) which means that in fact doubling the length of the wire will double the resistance therefore showing direct correlation. This is because when we increase the length of the wire there are more particles for the electrons of electricity to collide with therefore producing a higher resistance.
EVALUATION
Overall I feel that the accuracy of my experiment was very good and accurate. This can be shown by looking at my graph and we can see that there is only one point that is not on or very near the line of best fit. That point was only slightly out and did not affect the final gradient of the graph. I feel I can rely on the results that I collected because if we look at the results for the same length of wire we can see that the 2 readings are very similar which means that I can rely more on them.
I do not think doing any more test would improve the accuracy of this experiment the only way to do that would be to change the way the test was carried out.
To improve the accuracy of the experiment an extra person would have helped enormously especially the in preparing of the wire and obtaining the desired length. Also using a more precise voltmeter and ammeter in the experiment would have improved the accuracy of the readings. A rheostat (this is a device to vary the amount of a current passing through it to complete a circuit2) could also be used to minimise errors when preparing a length of wire about to be tested. I would also try and regulate the temperature as this can affect the resistance of the wire.
In my introduction I mentioned the following variables heat, length, diameter, atmospheric pressure and height. I have investigated how length affects the resistance and if I had more time I would then go on to investigate the effects of diameter on the resistance of a fixed length of wire. I would do this by using different diameters of wire but using the same length. The reason for the diameter of the wire affecting the resistance is almost the same as for the length. If one increases the diameter of the wire one is increasing the amount of particles which the electrons can collide with therefore increasing resistance.
2 Definition from www.energyquest.ca.gov
Y:\svn\trunk\engine\docs\working\working\29952.doc Page of