First of all I left the solutions for 5 minutes, after recording the chips starting weight and resulting weight I found that there had been little reaction and that more time was needed for the reaction to take place.
I estimated that we should leave the solution for 4 times the amount of time we had tried before. After preparing the chips in exactly the same way I had done originally I cut them at the same length and weight, used the same scales and used the same strength solution, but just changed the duration of time to 20 mintues. After collecting the results I found that they were much easier to compare, as there was a far greater range.
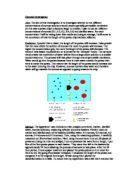
Below is the diagram of how the preliminary experiment worked:
A molar solution has the molecular mass in grams dissolved in one litre of water. Sucrose is C12 H22 011 (atomic mass 254)
Preliminary Results
From these results I can see that the potato chip in the strongest molar solution diffused water (mass) from the highest concentration of water to the less concentrated solution through the semi-permeable membrane, thus losing weight.
Prediction
I predict, that as concentration increases, the weight and length of the potato chip will decrease. My reasoning behind this, is that the higher the concentration of glucose in a solution, the lower the concentration of water. When the potato chip is put into the solution, it will, by osmosis lose some of its water, and the water will diffuse into the solution of glucose, causing the potato chip to lose water, thus decreasing in mass and length.
In a high concentration of water the amount of solute (e.g. sugar) is low. This could be called a dilute solution.
In a low concentration of water the amount of solute is high. This could be called a concentrated solution.
However, if a potato chip is placed into a solution of 0 molar concentration, it should gain mass and length. This is because the solution has more water potential (its molecules’ ability to move) than the potato chip, and so water moves from a region of high concentration (the solution) to a region of low concentration (the potato chip.)
Moreover, there will be a point where the concentrations of water inside and outside the potato cells are equal (isotonic.) At this point there will be no change in mass or length. This is because no osmosis is taking place and there is zero net movement of water.
I also predict that the graphs from both the length experiment and from the mass experiment will be very similar. This is due to the fact that osmosis will have a similar effect.
Titration
Fair test
To create a fair test certain aspects of the experiment will have to be kept constant whilst one key variable is changed. I have chosen to vary the concentration of the sucrose solution.
For the purpose of my experiment I am going to carry out all the experiments at the same time so the temperature is kept almost the same throughout.
The length of the potato is a dependent variable. This means that it will be measured throughout the experiment. I will measure the length in centimetres. The potato chip will be measured before it is put in the solution, and after. This will allow us to see whether osmosis has taken place, and to what extent. The volume of the solution that the potato chips are kept in must be the same. The potato chip must be totally covered in the solution, and the amount of solution will be kept the same because all the potato chips will be the same size. I am also going to use the same scales to weigh my potato chips. This is because the measurements may slightly vary between different sets of scales.
Apparatus
· 6 Test Tubes
· 150ml beaker
· Ruler
· Scalpel
· Small cutting board
· Core borer
· Marker Pen
· Sucrose solution
· 100 ml Syringe
Method
- Write on each of the test tubes and label them 0.0, 0.2, 0.4, 0.6, 0.8, 1.0.
- Using the syringe to carefully measure out, the correct ratio of sucrose and water for each concentration and place them into the appropriate Test Tubes.
- (For the length experiment) using the core borer bore approximately 20 pieces of potato from your own potato (make sure it is hard and healthy). Using the ruler, cutting board and scalpel, measure out 18 pieces of potato, each 4cm then cut to size with scalpel.
- (For mass experiment) using the core borer bore approximately 20 pieces of potato from your own potato (make sure it is hard and healthy). Using the ruler, cutting board and scalpel, measure out 18 pieces of potato, measure roughly the size then, weigh each piece of potato and make sure each weighs roughly similar. This will make the test fair as I am looking for changes in mass.
- Put three pieces of potato into each test tube and put. Make sure you record the time, as the potatoes must only be in the solutions for up to 48 hours.
- Leave the potatoes for 48 hours, as this will give enough time for osmosis to take place.
- After 48 hours, take out each potato chip and put them onto a piece of paper towel to dry. Once they have dried, weigh each of them, making sure you note which concentration each was in.
- Draw up a table of results and enter in your results.
- Find the weight for each concentration and then find the percentage increase/decrease for each and find the average for this too.
Precautions
- Whilst cutting the potato, extreme care and precision must be taken with the scalpel, as it is very sharp and could easily cause a serious wound.
- The measurements for the solutions have to be perfect as to not change the out come of the experiment.
- Ensure that every time you handled the potatoes your hands are clean and dry. This is to stop any kind of contamination and make sure that you do not pass on any extra moisture.
Results for Osmosis Experiment: Increase/Decrease length
All results in cm’s
Conclusion For Length Experiment
Figure one ‘Average length percentage difference’ shows very much what I had predicted. As concentration of the solution increases, the length of the potato decreases. In this graph, I had many negative results. This shows that length is very strongly affected by osmosis.
Whether or not the potato chips grow or shrink is due to the turgor pressure and wall pressure. A fully stretched cell wall is restraining inward force on called wall pressure on cell contents. An equal but oppositely directed forced called turgor pressure in the cell contents, and when the cell wall can stretch balances this wall pressure
The average results for the 0.0 and 0.2 Molar show that the potato cylinders are turgid when removed from the solution. This means that the cell has swollen and as a result the cylinder has grown in mass and length.
The average results for 0.4, 0.6, 0.8 and 1.0 Molar solutions show that the potato, these potato cells were placed in a solution with a low water concentration, and the opposite has happened. Water has moved out of the cell into the solution. In extreme cases the cell membrane breaks away from the cell wall and the cell is referred to as plasmolysed. The potato cells will have decreased in length, volume and mass.
From my results and my graph I can conclude that the movement of water through a selectively permeable membrane is affected by concentration of glucose solution. The higher the concentration of glucose solution, the more the potato chip will lose its length.
The isotonic point of the solution was in between the concentration of 0.2 – 0.4 Molars, it can be estimated at 0.32 molars but it must be noted that this is estimation and that each potato cylinder will not be identical in concentration.
Results for Osmosis Experiment: Increase/Decrease in mass
All results in Grams
1st Test
2nd Test
3rd Test
Conclusion for Mass Experiment
The results from the Mass experiment although not having similar figures to the length experiment had the same conclusion. The higher the concentration of glucose solution, the more the potato chip will lose its mass.
From the graph (Average Mass Percentage Difference) an estimate to the concentration of the potato cell can be made as 0.2 M. As this is the point where the potato is not increasing or decreasing in mass. This view is solidified in the results as all three tests that I carried out came out convincing, they all showed that when the solution was at 0.2 M then the mass of the potato would not change. However, it is important to realize that this is only an estimate as the potato cells will not be uniform in their concentration.
The graph is a curve that slopes downwards and does not go through the origin. Because the line is not straight and does not pass through the origin, it means that the percentage gain and loss in mass and concentration are not directly proportional. However, there is a pattern on my graph, and this is, as the concentration of the solution increases, the percentage change in mass decreases. The graph shows that the percentage gain and loss in inversely proportional to the concentration.
The isotonic point of the solution was in between the concentration of 0.0 and 0.2 Molars. But as there was an anomalous result in the 0.4 molar solution on the “Average mass percentage difference graph” the graph had to take a manufactured curve, which resulted in too inaccurate results to come to conclusions about the isotonic point. But a rough estimate could be made at 0.12 Molars.
Evaluation
I believe the test gave the expected prediction but was not successful in way of accurate results.
The fact that the prediction and the results have a fairly strong resemblance is good evidence that the test was fairly accurate.
The accuracy of the investigation was adequate, however the concentrations were measured using a measuring cylinder and could be made more accurate using titration. Also when the potato was dried to remove surface liquid it was not necessarily done the same on each potato, a more accurate and uniform way of drying would improve the accuracy further.
Further work could be carried out to include concentrations that increased in 0.1 M rather than 0.2. This would increase the accuracy and improve the graph. Other investigations could include using different varieties of potato or different plant tissues.
I feel that the scales I used during the experiment to weigh the potato cylinders was insufficient for an accurate test. It only gave masses to the accuracy of one decimal place. To do the test again using scales, which measured to 5 places, at least would result in a far more decisive graph and more accurate results.
There were two obvious anomalous results, but some were not as close to the line as others. This may have been caused by human. When the potato chips were removed from the test tubes and dried I may well have dried some potatoes more thoroughly than others and so some would have more excess water, which would add to the mass. If the experiment was repeated I could find another way to dry the potatoes that would ensure that all were dried in the same way for the same time. However with all this said I think that the experiment was truly successful and I was very pleased with the complete comparison of my results with my initial prediction.