The main outcome of this experiment found, is that the higher the concentration of sodium thiosulphate, the faster the rate of reaction becomes. From this experiment, we measured the effect of concentration depending on the rate of reaction.
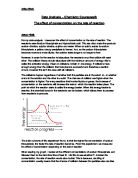
When reading my graph, I looked at the different concentrations of sodium thiosulphate, and followed them to the trend line/ line of best fit. I did this to see whether if I doubled the concentration, the rate of reaction would also double. This is because, doubling of concentration usually means that the chance of collision between the particles also doubles. I found that this was more or less the case, however because the results were not 100% accurate due to some error bars, they were not exact. For example, where the concentration was at 0.05 (mol/dm3), the rate of reaction was 17.1; when the concentration was at 0.1 (mol/dm3), the rate of reaction was at 24.3. The closeness of 17.1 doubled, with 24.3 is extremely close, which proves that the chance of collision is higher. Another example is when the concentration was at 0.04 (mol/dm3) the rate of reaction was at 9.8, and when at 0.08, the rate of reaction was at 19.8. This is also a very close result comparison. Although this is not exactly doubles, it is close enough, and could suggest that the results found were quite accurate, which made me more confident with them.
From my graph, the error bars that have been plotted are quite close together, meaning that my results are quite reliable. However, on some points the error bars are wider apart, which suggest that some results were more accurate than others.
EVALUATION:
Through the experiment, we took reading for 8 concentrations and rates of reactions. We did this to make the results more reliable, and to make ourselves more confident with the outcomes. We measure the time taken for the reaction to occur, by measuring how long the solution took to become a yellow, cloudy precipitate. As a result of this, sulphur is the product.
In order for this to be measured, we placed the solution made up of Sodium thiosulphate and HCl, in a conical flask and out it over a piece of paper marked with a thick black cross. This was so that we could look over the conical flask and time with a stop watch how long it took before the cross was no longer visible through the flask after the hydrochloric acid was added in.
The equipment that was used for the experiment was; a stopwatch, a conical flask for the solution, marked piece of paper, 2 measuring cylinders for both reactants )1-ml and 50ml) and pipettes. I thought the equipment used was of good use, however many improvements could have been made which could have an impact on the end results of the experiment. For example, the dropping pipette that we used could have been replaced by a graduated pipette of a burette.
A graduated pipette, and burette have much more control over the acid/solution being placed in them. It would have been a way to make results much more accurate, as there would be a better knowledge of how much, exactly, acid has gone in or out of the flasks/cylinders.
I thought the conical flask was an accurate way in which the solution was help as it gave second measurements along the side, making it more obvious of the measured solution.
We did the experiment over 2 days, which means the temperature in the atmosphere could have changed throughout the time we were measuring the concentration. Other factors could have contributed to the rate of reaction, such as the surrounding temperature. We measured the reaction through visual senses, however I think a data logger would be of much more accurate use. This is because the results can be taken in by a computer meaning they will be much more accurate. Also, if the data logger had a light censor built in, everything would me more precise as it would be able to detect and sense when the solution becomes cloudy straight away. However, this is not as precise as it sounds, as the data logger and light censor will not be able to tell when the reaction has come to an end.
We started out concentration at 0.045 (mol/dm3) and carried on until 0.15 (mol/dm3). To make the results more reliable, a lower concentration could have been used. However, the data I collected was reasonable, and I am confident with them.
The line of best fit that I have drawn onto my graph is quite accurate as an equal amount of results are either side of it. The information/results that can be interpreted from this graph are not perfect as the line of best fit does not go through all the points. Also, the most accurate result, which was the concentration of 0.09, goes through this line of best fit. The result of 0.09 was the same in both experiments which shows it has great accuracy, unlike some of the other results – outliers. The result that was an outcome of the concentration 0.12 has the biggest error bar, meaning that the measurement is less reliable. To improve this for next time, I would possibly re-do this particular measurement experiment, to ensure that results make sense and are more accurate.
Overall, considering all the points made about the experiment, I am happy with my results and I have confidence in using them. The conclusion that I have come to, which was the prediction of this experiment, was that the higher the concentration of sodium thiosulphate, the faster the rate of reaction occurs. Although there could have been small changed made to how the experiment was carried out, i.e. The equipment that was used, it still produced good, reliable and more or less accurate results which is the main point.