In order for me to complete this investigation I will need to take in to consideration the variable and the constants.
Variables:
In this investigation there can be only two variables, voltage and the length of the wire. The length of the wire affects the resistance in such a way that if the length is increased, the electrons have a lot further to travel and therefore the current flowing through the wire decreases and the resistance increases. If the wire is short then the electrons have to travel a reduced distance and therefore the current increases and the resistance decreases. I am only going to vary the length because the length fits in to the formula to find resistivity (ρ=RA/L). I will take readings at intervals of 10cm, and for each length I will take 3 reading in order to work out the average. I will use the following lengths, 400cm, 500mm, 600mm, 700mm and 800mm. After working out the average current and voltage I will plot a V/I graph (must be a straight line graph because I know that resistance is ∝ to length) and work out the gradient (the gradient is equal to resistance) this will give me more accurate results. After working out the resistance for each length, I’ll work out the cross-sectional area of the wire, and then plot a graph of RA by L, and the gradient for this will give me Resistivity.
Constants
Voltage- this will need to be kept the same, because if the voltage increases then the current will increase, and as current increases, resistance decreases. The voltage will be kept at 2V during the investigation.
Wire- the same wire will be used for each length, because if a different wire is used then the resistance could be affected because the material of the wire would differ, and hence the thickness of the wire would differ, the more thicker the wire the less the resistance.
Ammeter- the same ammeter will be used to avoid systematic errors, and to ensure that the investigation is kept fair.
Voltmeter- the same voltmeter will be used to avoid systematic errors, and to ensure that the investigation is kept fair.
Temperature- The temperature of the wire has to remain at room temperature because if the temp of the wire increases the ions in the metal move faster, which then becomes an obstacle for the free electron to pass through, and the electron has a much harder route to follow, and for this reason the resistance will increases. This is also known as drift velocity.
Safety:
- Ensure hands are dry before starting the practical;
- Clear the work area of any unwanted objects (i.e. bags, coats etc);
- Use low voltage (2V);
- Allow wire to cool down before touching it.
Method:
- Use the micrometer to find the diameter of the wire that is being investigated. Take 3 readings to get an average.
-
After collecting the 3 results and working out the average, use the formula area = πr2 to work out the cross-sectional area of the unknown wire.
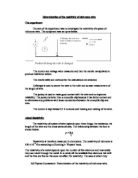
- Set up apparatus as shown below, making sure that the ammeter is connected in series and the voltmeter is connected in parallel.
- Connect the crocodile clips on the wire, one at 900mm and one at 100mm to take a reading for 800mm.
- Turn the power pack to 2V.
- Make sure the equipment is set up correctly and safely, after doing this turn on the power pack.
- Take 3 readings of current and voltage for each length, making sure that after each reading the wire is allowed to cool down to room temperature, to keep the investigation fair.
- After recording the results, work out the average current and voltage for each length.
- Using the formula R=V/I, work out the resistance for each length, and also plot a V/I graph for each length to work out the gradient of the line, which will also show us the resistance, results are likely to be more accurate.
- After recording the resistance, plot the RA/L graph, and work out the gradient, which is also equal to resistivity.
- Match the value of resistivity of the wire with one from the data book, and hence identify the unknown wire.
Diagram
Preliminary
I carried out preliminary work to see how the temperature of the wire was affected at lengths between 300mm to 900mm; I kept the voltage constant at 2V. From the results table above, we can see that the resistance at 300mm was very low, hence the wire was getting too much current through it, and because it was getting excess current the temperature increased causing the wire to burn. At 900mm the resistance was too high simply because the electrons had a longer distance to travel. For these reason I have chosen to investigate the wire using lengths 400mm, 500mm, 600mm, 700mm and 800mm.
Diameter of wire
For this I measured the wire’s diameter with micrometer six times to get a mean (average) as this increased the precision.
From this value I calculated the cross sectional area of the wire using the formula:
π (d/2)² = A
π (0.39/2)² = 0.11945906
= 0.12mm² (2 s.f.)
Results
As I am plotting a graph of resistance against length/area I will need the following information:
Conclusion
After plotting my graph, I can now work out the resistivity of the unknown sire by working out the gradient.
Gradient = dy/dx
=1.44/2.95
=0.488
The gradient value is in mm, so I must convert it into meters.
√0.488 = 0.699/1000
= (6.99x10⁻⁴)2
= 4.89x10-7
= 48.9x10⁻⁸Ωm
On the graph I also plotted a maximum gradient so I can work out my total error.
Maximum gradient = 1.44/1.48
= 0.973mm
Convert into meters,
√0.973 = 0.986/1000
= (9.86x10⁻⁴)2
= 97.2x10⁻⁸ Ωm
Therefore, the total error = maximum gradient – original gradient
= (97.2x10⁻⁸ Ωm) – (48.9x10⁻⁸Ωm)
= 4.83x10⁻⁷Ωm
Therefore the total resistivity value = 48.9x10⁻⁸Ωm ±4.83x10⁻⁷Ωm
From the data book, I found the material Constantan to have a value of resistivity, that of mine. My unknown wire is therefore Constantan.
Evaluation
Errors
There are two types of errors:
Systematic- this could be caused by in calibrated scales, if there is a very small systematic error then we say the measurements are accurate.
Random- these are errors made during the measurements, usually mistakes by the investigator in reading the scale, if there is a very small random error we say the measurements are precise. Repeating the measurements and calculating an average can reduce random errors.
The following random and systematic errors could be made:
Calculating percentage errors
To calculate the total % error:
Error for resistance = error in voltmeter + error in ammeter
R = V/I (R = resistance, V = Voltage, I = Current)
Error in voltmeter = ±0.5%
Error in ammeter = ±1.0%
Total error = ±1.5%
Therefore, error in resistance = ±1.5%
Error for length/area = ±1mm (ruler)
= ±0.02mm (micrometer)
Error in area using micrometer = ±0.01 x 2 because of the formula, πr²
Error in length + error in area = total area of length/area
±1 + ±0.02 = ±1.02
From the information I will calculate the percentage error on my graph.
Error bars
The error bars are calculated by the formula:
(1.50/100) x (average resistance value) = error bar on graph
400mm
(1.50/100) 1.22= ±0.02
500mm
(1.50/100) 1.49= ±0.02
600mm
(150/100) 1.80= ±0.03
700mm
(1.50/100) 2.24= ±0.03
800mm
(1.50/100) 2.71= ±0.04
The horizontal percentage error bars were to small for me to plot on my graph, because my scale was too small.
Overall the percentage errors for the resistivity are quite small, but this could also be minimised by using more accurate equipment, and also by increasing the number of readings I took for each length, this would get me a more accurate average.
From my results and my graph I can see that my results are quite reliable. However, they are not 100% reliable because I have two anomalous results. The two anomalous results appear at the lengths of 600mm and 700mm.
The probable causes for these anomalous results could be due to a temperature difference. The temperature affects the resistance of a wire easily, and is a variable that needs to be kept constant. As the temperature increases the resistance also increases, this is because the resistance is proportional to the temperature (RαTemperature). The reason for this is because when the temperature is high, the ions in the wire are vibrating more violently and more randomly, and therefore reducing the chances of the free electrons to travel across the wire.
Alternatively taking incorrect readings from the equipment may have caused the anomalous results. This is an example of a random error. The two anomalous results may also be caused by one of the constants not being kept constant, i.e. the voltage may have been changed without me noticing.
The techniques I used in this investigation were quite reliable, despite the two anomalous results. As the percentage error is quite small, the reliability of my results and my conclusion are dependable upon. However, they are not strong enough to support a firm conclusion.
Even though my techniques were quite reliable, I could make some changes to make it more reliable. Some of the changes I could inflict include:
- Though I took three readings of the voltage and the current, I could improve my average by taking about five separate readings for both the voltage and the current for each length.
- Instead of using crocodile clips to hold the wire in place, I could use pointers, this would improve my investigation because the area that is in contact with the wire would be much smaller, and therefore allow me to measure the wire more accurately.
- I could minimise the temperature error by allocating an interval time in between each reading this would allow the wire to cool back down to room temperature. The temperature of the wire increases slightly every time current is passed thorough it.
- Use a wider variety of lengths to get a more spread of findings, this would help me achieve more accurate average and a better understanding of the behaviour of resistance on the wire.
- Repeating the same investigation, but this time I would vary the width of the wire instead of the length, this would also enhance my understanding of how the resistance is affected in different situations.
Overall my from my investigation I can say with confidence that my hypothesis was correct. As the length of the wire increased, the resistance also increased. This is due to the current having a longer distance to travel, passing an increased number of ions in the lattice arrangement of the wire.